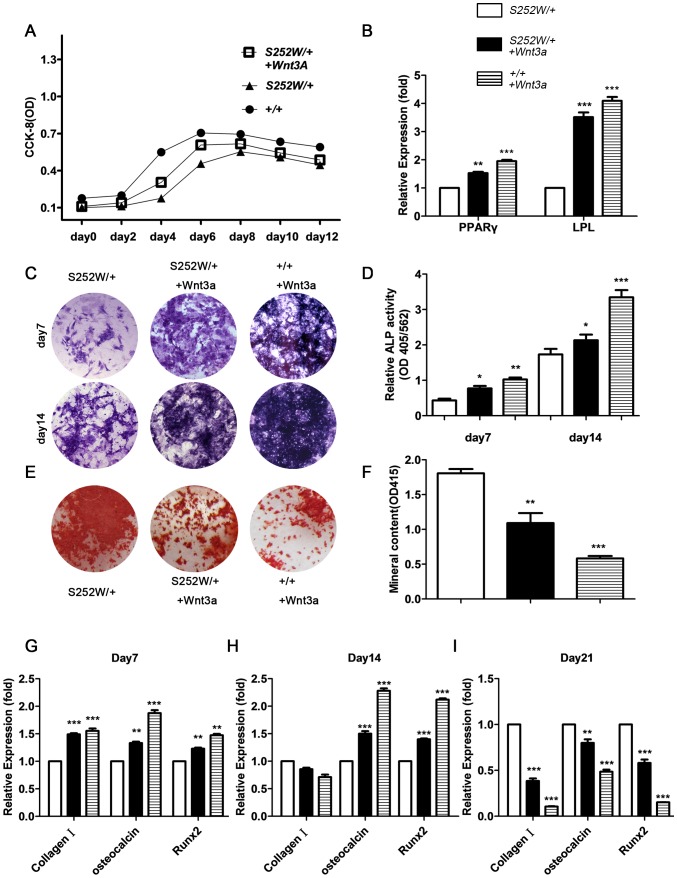
Figure 7. Activated FGFR2 and the proliferation, adipogenic differentiation, osteogenic differentiation, and mineralization of BMSCs.
(A) CCK-8 proliferation assay showed Fgfr2 S252W/+ BMSCs treated with Wnt3a to proliferate less than wild-type BMSCs treated with Wnt3a but more than untreated Fgfr2 S252W/+. (B) After 21 days of adipogenic induction, expression of adipogenesis-related genes PPARγ and LPL was examined using qRT -PCR. Results showed that expression levels of PPARγ and LPL in Fgfr2 S252W/+ BMSCs treated with Wnt3a were lower than in wild-type+Wnt3a BMSCs but significantly higher than in untreated Fgfr2 S252W/+ BMSCs. (C) ALP staining showed more crystal violet-staining cells in cultured Fgfr2 S252W/+ treated with Wnt3a BMSCs than in untreated Fgfr2 S252W/+ BMSCs on days 7 and 14. (D) ALP activity (normalized to the total protein content of the sample, 562 nm) was significantly higher in Fgfr2 S252W/+ treated with Wnt3a BMSCs than in untreated cells. (E) After 21 days of osteogenic differentiation, Alizarin red staining of the mineralized osteoblasts showed that wild-type BMSCs treated with Wnt3a had the fewest mineralized nodules, followed by Fgfr2 S252W/+ treated with Wnt3a, and untreated Fgfr2 S252W/+ BMSCs had the most nodules. (F) Cultured wild-type BMSCs treated with Wnt3a showed the least mineral content, followed by Fgfr2 S252W/+ BMSCs treated with Wnt3a, and untreated Fgfr2 S252W/+ BMSCs had the highest mineral content. (G) Relative expression levels of osteogenic marker genes were measured using qRT–PCR. The expression levels of oc, and Runx2 mRNA were markedly higher in differentiated Fgfr2 S252W/+ treated with Wnt3a BMSCs than in untreated Fgfr2 S252W/+ BMSCs on days 7 and 14, but markedly lower on day 21. The expression levels of Col1 were markedly higher in Fgfr2 S252W/+ BMSCs treated with Wnt3a than in untreated Fgfr2 S252W/+ BMSCs on days 7, but lower on day 14, 21. Graphs show mean value ±SD (Student's t-test, *P<0.05, **P<0.01, ***P<0.001).

