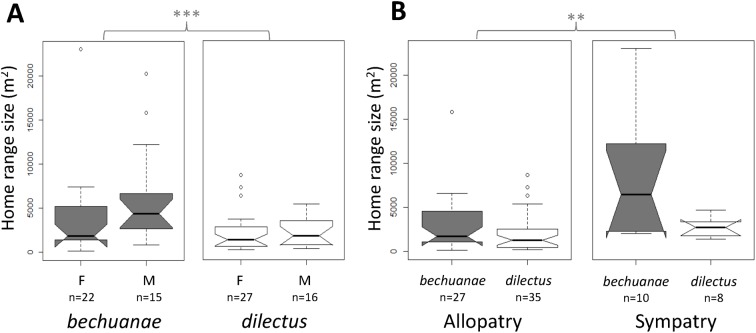
Fig 4. Home range size estimates.
Home range size estimates (isopleth 0.95) across species (grey: bechuanae, white: dilectus), A: sex (F females and M males) and B: “geography” (** p<0.01, *** p<0.001 refers to Ancova results in S2 Table). Box-plots show the median (thick line), first and third quartiles. Non-overlapping notches are roughly equivalent to 95% confidence intervals.

