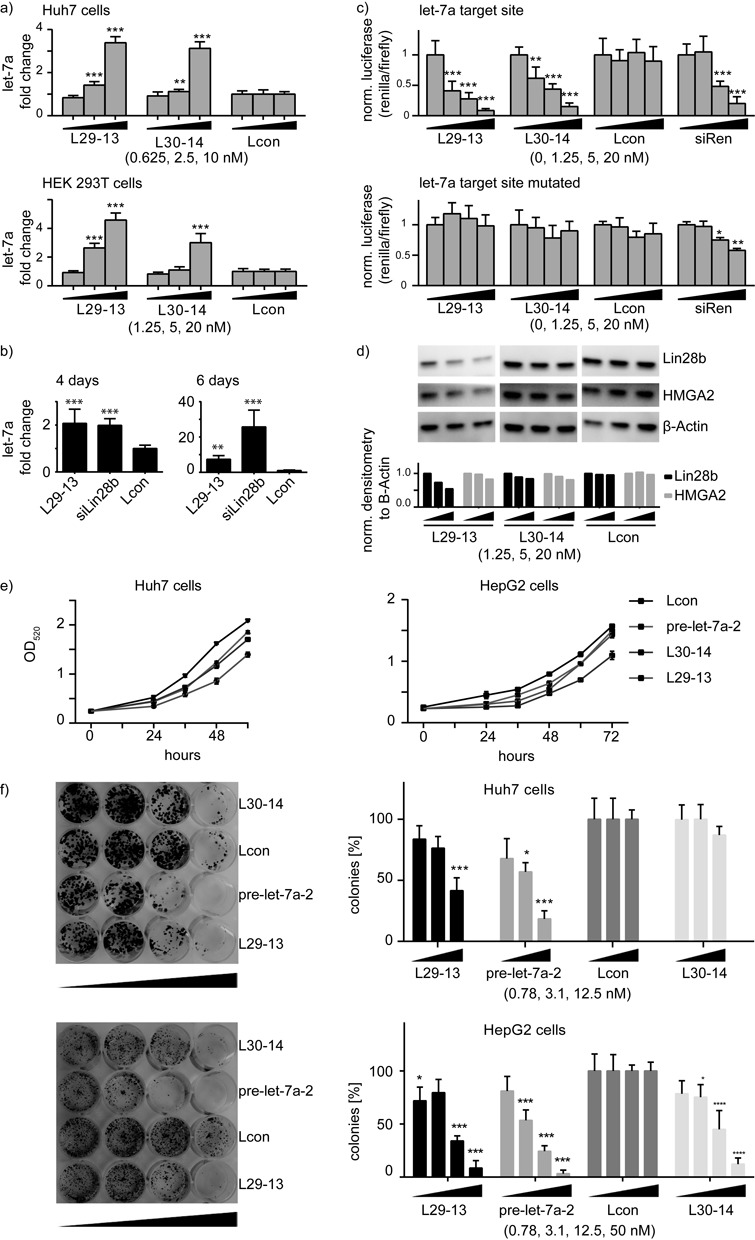
Figure 3.

Looptomirs L29-13 and L30-14 induce the expression of functional let-7a. (a) Endogenous levels of mature let-7a 48 h after transfections of L29-13, L30-14 and Lcon in Huh7 and HEK 293T cells, measured by TaqMan RT-qPCR (normalized to RNU44 and Lcon); similar results were found in HepG2 cells (Supplementary Figure S6). (b) Activity of L29-13 and siLin28b in sphere-forming HepG2 cells: TaqMan RT-qPCR of cancer stem-like cells measuring endogenous let-7a levels 4 (left panel) and 6 days (right panel) after transfection of L29-13 at 50 nM concentration. (c) Looptomirs and controls were co-transfected with dual-luciferase vectors into Huh7 cells to measure activity of endogenous let-7. Upper panel: a ‘sensor’ vector containing one let-7a fully complementary target site; lower panel: the same construct mutated at 3 positions in the seed sequence. (d) Western blots showing levels of let-7 target proteins Lin28B and HMGA2 after treatment of Huh7 cells with let-7 looptomirs. (e) Huh7 (left panel) and HepG2 (right panel) cells were transfected with 50 nM of L30-14 and L29-13, as well as pre-let-7a-2 and Lcon controls. OD of stained cells was measured over a 4-day period: OD was normalized to the Lcon treatments. Error bars are SD; ***: P < 0.001. (f) Huh7 (upper panels) and HepG2 cells (lower panels) were transfected with 0.8, 3.1, 12.5 and 50 nM of looptomirs and controls. Colonies were stained with crystal violet and counted after 10 days; cell numbers were normalized to Lcon treatments (toxicity was observed in the 50 nM treatment of Huh-7 cells). Error bars are SD; ***: P < 0.001.
