
Figure 2.
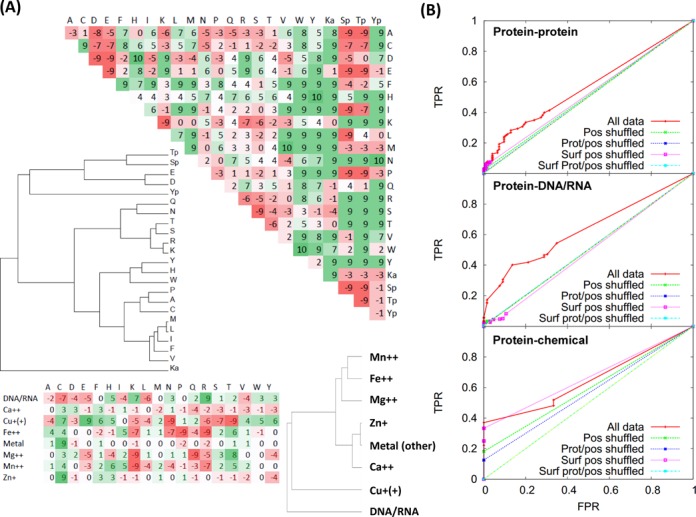
(A) Log-odds scores for amino acid side-chains interacting with other side-chains (top) and DNA/RNA and chemicals for which appropriate parameters are available (bottom). Values are multiplied by 10 and stripped of decimals for clarity, and are coloured red if unfavourable and green if favourable, with darker colours indicating stronger values. Modified amino acids are given as: Ka, acetyllysine; Sp/Tp/Yp, phospho-serine/threonine/tyrosine. Note that this is not a mutation or substitution matrix, but a measure of residue–residue interactions. The dendrograms show means clustered groups using distances between amino acids/molecules calculated by summing the absolute differences between matrix values. (B) ROC curves showing how accurate the direction of interaction effect is predicted based on a data set human mutations with annotated in Uniprot for disabling/enabling effects on protein, chemical or DNA/RNA interactions. ‘All data’ denotes the data set, with various shuffled data sets also shown: Pos denotes different positions in the same protein, Prot/pos denotes different proteins and positions and Surf denotes where accessibility values are maintained between the original data set and the shuffle.