
Figure 3.
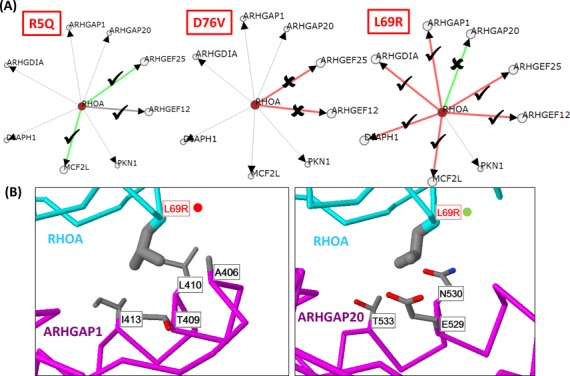
(A) Network of RhoA and interaction partners showing the predicted effect of each mutation on a selection of interaction partners with structures sharing very high sequence identities with the human protein. Green lines show interactions where RhoA mutations are predicted to enhance the interaction; red lines where they diminish. Proteins linked with thin lines are those that interact with RhoA via an interface of known structure that does not involve the mutation. Tick/cross marks denote whether the proposed effect was observed in the two-hybrid tests. (B) Structures of RhoA mutation L69R in contact with three interactors. Proteins are shown as C-alpha trace with residue side-chains shown as wireframe (carbon = grey; oxygen = red; nitrogen = blue). Red labels show the location of the mutated RhoA residue; black those with which it is interacting on the other protein. Red circles indicate a disabling prediction, green an enabling one.