
Figure 1.
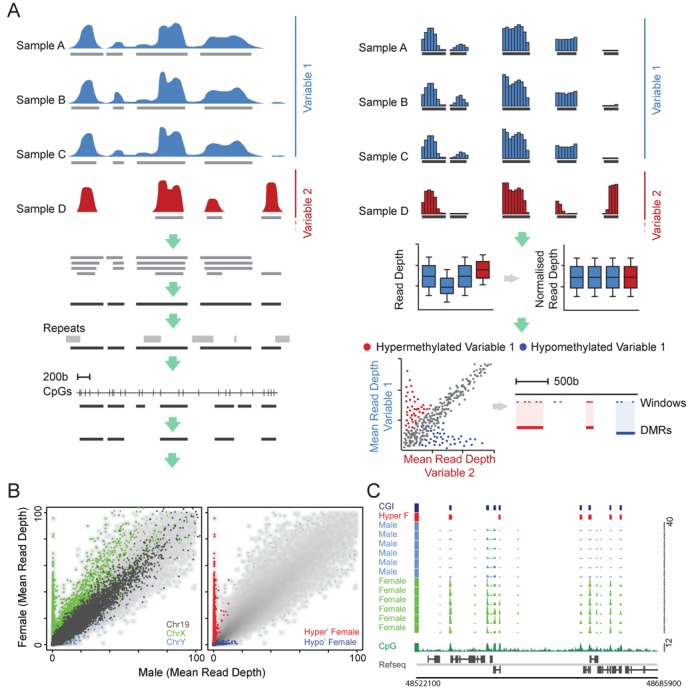
DMR identification strategy. (A) Schematic representation of the DMR identification procedure. Indicated is a hypothetical data set where samples representing two biological variables (red and blue) are processed to identify regions of significantly differential methylation (see text for details). (B) Scatterplots depicting male and female averaged MAP-seq read depths for all MAP regions. The first plot shows the relative read depths for all windows on chromosomes X (green), Y (pink) and 19 (grey; left panel). The second plot shows the same data as the first but highlights windows which were identified using the MAP-seq analysis strategy as being significantly hyper- or hypomethylated in female versus male samples (red and blue, respectively). (C) A representative region of the X chromosome (chrX: 48513000–48740500; hg18) showing the MAP-seq profiles for male and female samples (pink and green, respectively). Female-specific hyper- and hypomethylated DMRs are indicated (red and blue boxes, respectively). CpG islands (CGIs; dark blue boxes), forward and reverse strand refseq genes (upper and lower panel, respectively) and CpG density profiles (CpGs per 100 bp; dark green plot) are displayed for reference.