
Figure 4.
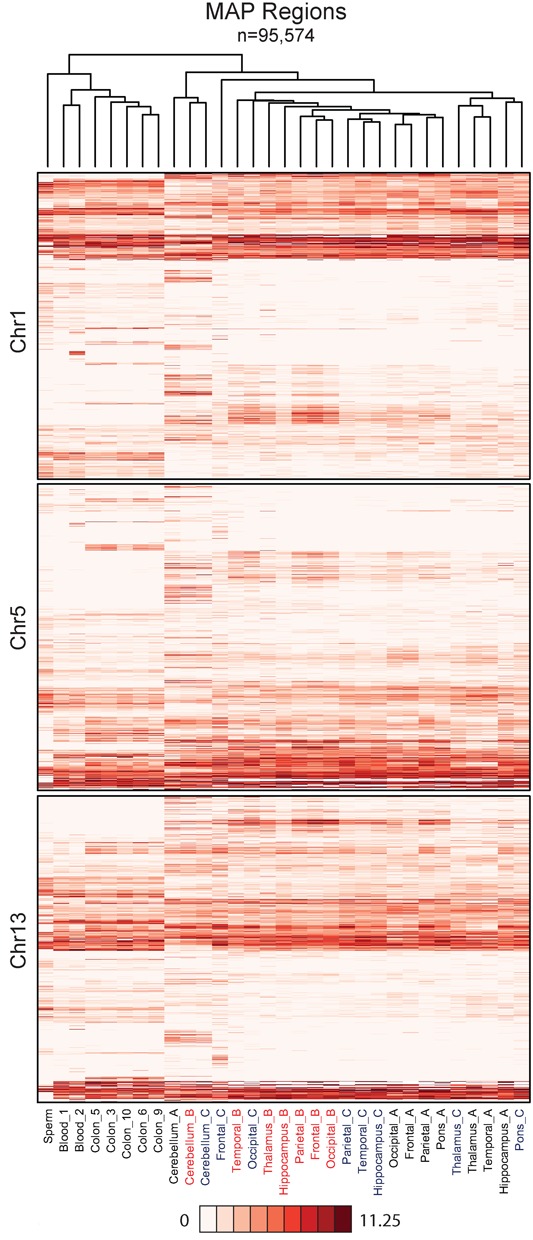
Hierarchical clustering identifies a high level of concordance between the methylomes of different brain regions from the same individual. Heatmaps show the average read depth for all ‘MAP-regions’ on chromosomes 1, 5 and 13. Columns are ordered based on clustering for all autosomes as illustrated by the dendrogram.