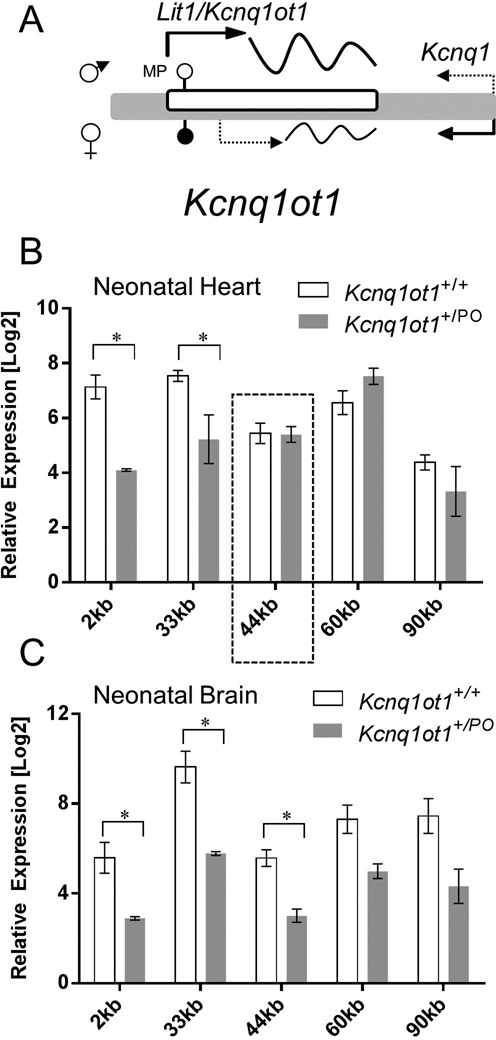
Figure 5.

Analysis of cardiac and brain Kcnq1ot1 ncRNA expression. (A) Schematic of Kcnq1ot1 region (not to scale). Filled and unfilled circles are methylated and unmethylated CGIs, respectively and dotted arrow represents maternal transcription of the ncRNA in the heart. (B) Comparison of Kcnq1ot1 levels in neonatal hearts of wild-type and Kcnq1ot1+/PO mice with primers located 2, 33, 44, 60 and 90 kb downstream from the canonical transcriptional start site. For qPCR, mean CT values were normalized to the geometric mean of β-actin, Ppia and Rplp1. Error bars indicate SEM. Asterisks indicate significant difference between wild-type and Kcnq1ot1+/PO (for 2 kb, P = 0.005, n = 4; for 33 kb, P = 0.0245, n = 4). The dotted box indicates the region in which expression is consistently diminished, coinciding with a candidate enhancer region (see Figure 7, main text). (C) Comparison of Kcnq1ot1 levels in neonatal brains of wild-type and Kcnq1ot1+/PO mice with primers located 2, 33, 44, 60 and 90 kb downstream from the canonical TSS. For qPCR, mean CT values were normalized to the geometric mean of β-actin, Ppia and Rplp1. Error bars indicate SEM. Asterisks indicate significant difference between wild-type and Kcnq1ot1+/PO (for 2 kb, P = 0.0478, n = 4; for 33 kb, P = 0.0024, n = 4; for 44 kb, P = 0.0162, n = 4).
