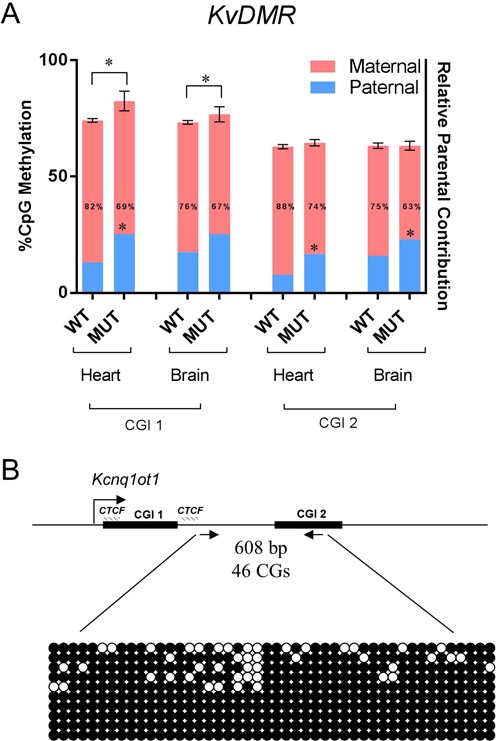
Figure 6.

Methylation analyses of the KvDMR in the absence of the Kcnq1ot minimal promoter. (A) Combined analysis of percent total methylation (as assayed by pyrosequencing) and allelic distribution of the methylation (as assayed by MeDIP) between Kcnq1ot+/+ and Kcnq1ot1−/PO neonatal heart and brain at the two CG islands downstream of the Kcnq1ot1 promoter (CGI 1 and 2). Asterisks above the bars indicate a significant difference in methylation levels (P = 0.008 for heart, P = 0.0017 for brain at CG1). Numbers inside the bars are percent maternal methylation relative to total and asterisks indicate a significant difference compared to wild-type (P = 0.0012 for heart at CGI 1, P < 0.0001 for heart, P = 0.0005 for brain at CGI 2, n = 4). (B) Bisulfite mutagenesis sequencing of oocytes from Kcnq1ot1−/− females. Arrows indicate the primers that amplify a 608 bp sequence including CGI 2, with a total of 46 CGs (primers in Supplementary Table S1). Top, schematic of the amplified region, indicating the CGIs, the CTCF binding sites and the direction of transcription of Kcnq1ot. Below, representation of the methylation status of 10 individual DNA strands. Filled circles, methylated cytosines.
