
Figure 2.
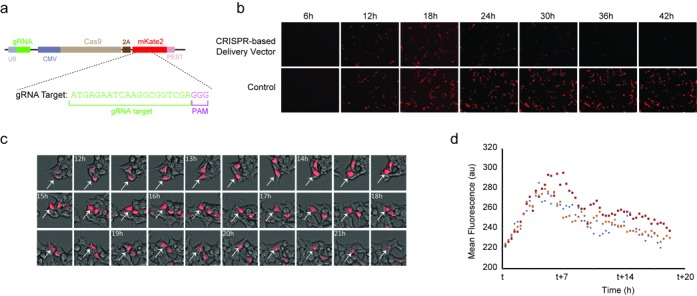
Initial validation experiments. (a) Representation of the single plasmid expression system with U6-gRNA combined with CMV-Cas9–2A-mKate2-PEST (pCas9–mKate2ps–T1gRNA). (b) Fluorescence microscopy time-lapse experiment showing the mKate2 dynamics for the CRISPR-based delivery vector (pCas9–mKate2ps–T1gRNA) and the control (pCas9–mKate2ps–CgRNA). Two hundred and fifty nanograms of each plasmid were transiently transfected in HEK293 cells. (c) Cropped images of the microscopy time-lapse showing the mKate2 dynamics in cells at 20 min intervals with post-transfection times shown. White arrow tracks a single cell. (d) Single-cell tracks showing mean fluorescence signal. The parameter t is the time after transfection of the CRISPR-based delivery vector pCas9–mKate2ps–T1gRNA (t = 6 h for blue, t = 10 h for red and t = 19 h for orange).