
Figure 3.
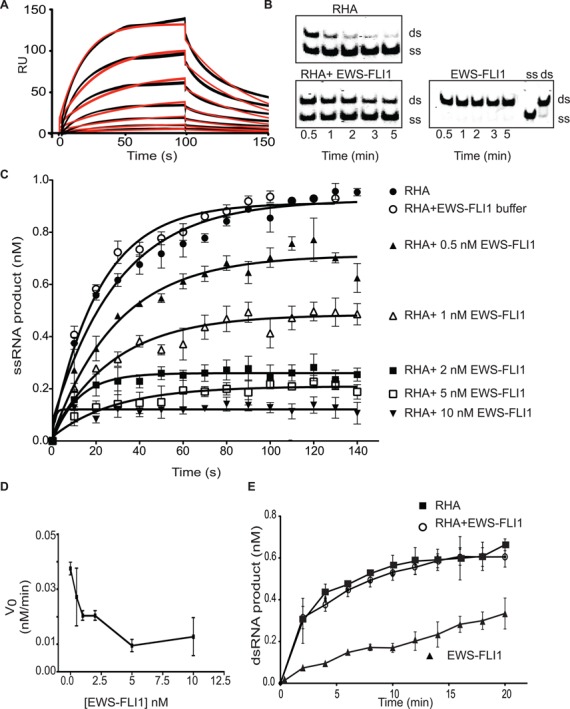
EWS-FLI1 interferes with the helicase activity of RHA. (A) EWS-FLI1 interacts directly with full-length RHA using surface plasmon resonance. Sensorgrams show a range of EWS-FLI1 concentrations (from 24 to 0.374 nM) in black lines. The model fits of these triplet values are represented by the red curves. The x-axis is the interaction time in seconds. The y-axis is the relative response unit (RU). The graph represents one of the nine independent experiments. (B) EWS-FLI1 inhibits the helicase activity of RHA. The upper band shows dsRNA and the lower band shows ssRNA. One nanomolar RHA shows complete unwinding (the upper gel) and 1-nM RHA was combined with 1-nM EWS-FLI1 that inhibited unwinding (lower gel). 1-nM EWS-FLI1 alone does not catalyze the helicase reaction (lower right gel). dsRNA and ssRNA were loaded to the gel as size markers (on the right). (C) Increasing concentrations of EWS-FLI1 were mixed with RHA in the helicase reaction. Single-stranded product formation of the reactions over time was plotted using the key: open circles (○) buffer control; closed circles (•) RHA alone; black triangle (▴) 0.5-nM EWS-FLI1; open triangle (Δ) 1-nM EWS-FLI1; black square (▪) 2-nM EWS-FLI1; open square (□) 5-nM EWS-FLI1; and black downward triangle (▾) 10-nM EWS-FLI1. (D) EWS-FLI1 affected the initial velocity of the RHA helicase reaction in a dose-dependent fashion. The x-axis shows the EWS-FLI1 concentration (nM), and the y-axis shows the initial velocity of the helicase reaction. (E) EWS-FLI1 did not interfere with the annealing function of RHA. The annealing reaction was carried out with 1-nM RHA—black square (▪)—or 1-nM RHA with 1-nM EWS-FLI1—open circle (○)—or 1-nM EWS-FLI1—black triangle (▴). The reaction was 20 min and the time course is plotted as dsRNA product (nM) versus time (min). Annealing experiments were carried out three times.