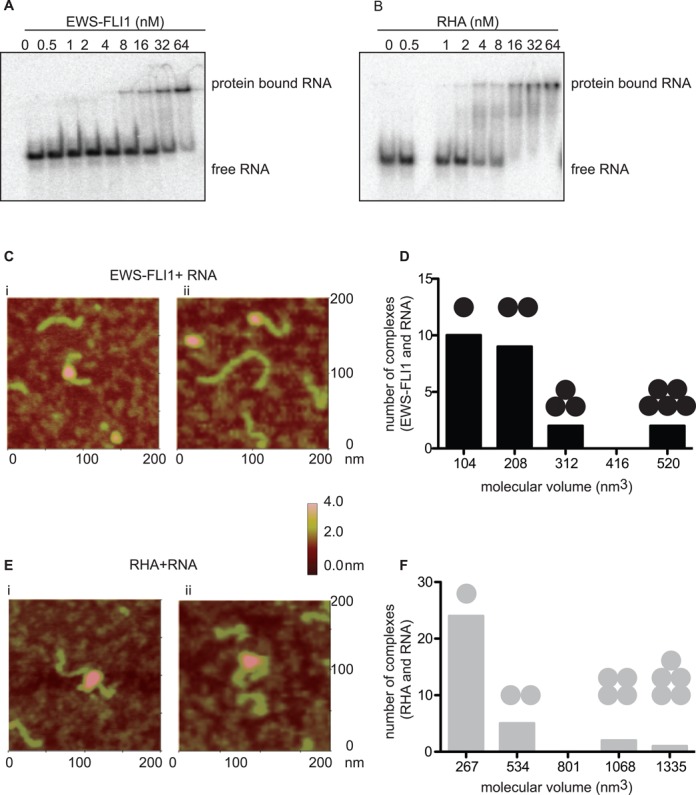
Figure 4.

EWS-FLI1 binds to RNA. (A) Concentrations from 0.5 to 64 nM of EWS-FLI1 bind to 32P-labeled 350-nt long dsRNA in gel shift assay, representative of three experiments. (B) Concentrations from 0.5 to 64 nM of RHA bind to 32P-labeled 350-nt long dsRNA in gel shift assay, representative of three experiments. (C) EWS-FLI1 binds to dsRNA. i–ii: AFM images of RNA-bound EWS-FLI1. The green object is dsRNA and the pink object is EWS-FLI1 protein. The color scale given on the right side of the image represents the height of the protein on the surface. (D) The volume distribution of RNA bound EWS-FLI1 (as the calculated volume of EWS-FLI1 was 104 nm3) protein complexes. The number of black spheres on the bar graphs represents the number of EWS-FLI1 protein on RNA complexes. (E) RHA binds to RNA. i–ii: AFM images of RNA-bound RHA. The green object is dsRNA and the pink object is RHA protein. (F) The volume distribution of RNA-bound RHA (as the calculated volume of EWS-FLI1 was 267 nm3) protein complexes. The number of gray spheres on the bar graphs represents the number of RHA proteins on RNA complexes.
