
Figure 6.
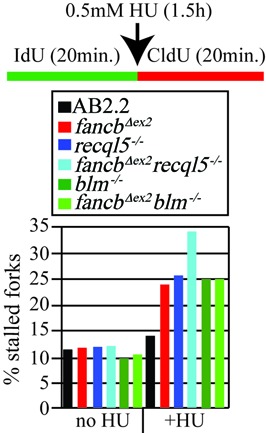
Replication fork restart for fancbΔex2 cells mutated for Recql5 or Blm. Refer to Supplementary Table S2 for statistics. These data are the average of a single experiment. For no treatment, the number of total fibers counted [restart, stalled and new origin]: AB2.2 control: 926 total [809 (87.37%), 100 (10.8%), 17 (1.84%)], fancbΔex2: 1497 [1304 (87.11%), 162 (10.82%), 31 (2.07%)], recql5−/−: 2137 total [1862 (87.13%), 234 (10.95%), 41 (1.92%)], fancbΔex2 recql5−/−:1752 [1498 (85.5%), 214 (12.21%), 46 (2.2%). blm−/−: 2135 total [1878 (87.7%), 216 (10.1%), xx (xx%)], fancbΔex2 blm−/−:1843 [1615 (88.6%), 194 (10.5%), 34 (1.8%)]. For HU treatment the number of fibers counted [restart, stalled and new origin]: AB2.2 control: 1809 [1516 (83.80%), 256 (13.93%), 41 (2.27%)], fancbΔex2: 2031 [1460 (71.89%), 516 (25.41%), 55 (2.71%)], recql5−/−: 2670 [1976 (74.04%), 638 (23.9%), 56 (2.1%)], fancbΔex2 recql5−/−: 2363 [1491 (63.1%), 798 (33.77%), 74 (3.13%)]. blm−/−: 1554 total [1136 (78.1%), 388 (25%), 30 (1.9%)], fancbΔex2 blm−/−:1880 [1374 (73.1%), 467 (24.8%), 39 (2.1%)].