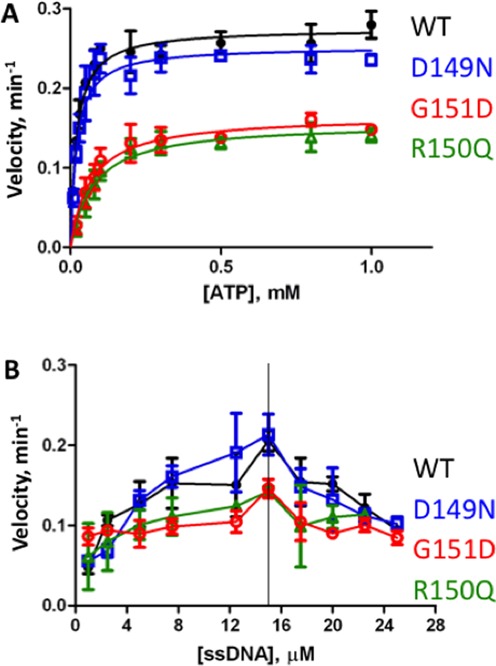
Figure 3.

Steady-state kinetics of ATP hydrolysis by variant and WT RAD51 proteins in the presence of ssDNA. Steady-state velocities were measured as described in ‘Materials and Methods’ section. Data points and error bars represent averages and standard deviations from three experiments. Data for RAD51 WT, D149N, R150Q and G151D are shown in black, blue, green and red symbols and lines, respectively. (A) Reaction velocity as a function of ATP concentration. ssDNA (6 μM) and protein (2 μM) were present at a ratio of 3 nucleotide residues per protomer, which is equivalent to the binding site size of RAD51 on ssDNA. (B) Reaction velocity as a function of ssDNA concentration. A constant concentration of 2 μM protein and a constant, saturating concentration of 1 mM ATP was maintained, while the concentration of ssDNA was varied.
