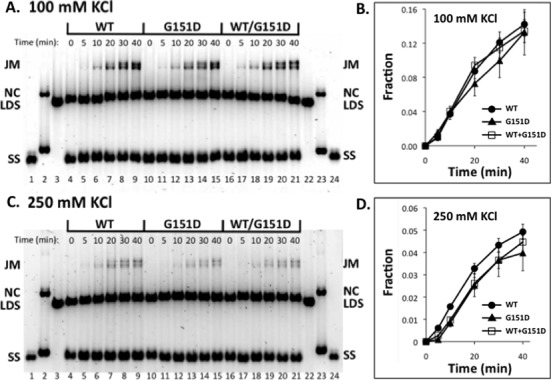
Figure 5.

Effects of salt and mixing with WT on the DNA strand exchange activity of RAD51 G151D variant. DNA strand exchange assays were carried out as described in ‘Materials and Methods’ section. Reactions were staged as described in Figure 4A. (A) Activities of WT, G151D and WT/G151D mixture in 100 mM KCl. Lanes 1–3 and 22–24 contain markers for SS, NC and LDS, respectively. Lanes 4–9 show the timecourse (0–40 min) of DNA strand exchange catalyzed by WT following reaction initiation by the addition of LDS. Lanes 10–15 show the timecourse (0–40 min) of DNA strand exchange catalyzed by G151D following reaction initiation by the addition of LDS. Lanes 16–21 show the timecourse (0–40 min) of DNA strand exchange catalyzed by a 1:1 mixture of WT and G151D, following reaction initiation by the addition of LDS. The total concentration of WT + G151D variant was constant in all reactions. (B) Quantified results from reactions at 100 mM KCl. Vertical axis denotes the fraction of total DNA appearing as joint molecule and nicked circle products. Standard error from two experiments is shown. (C) Identical to panel (A), except that reactions contained 250 mM KCl. (D) Quantified results from reactions at 250 mM KCl. Standard error from two experiments is shown.
