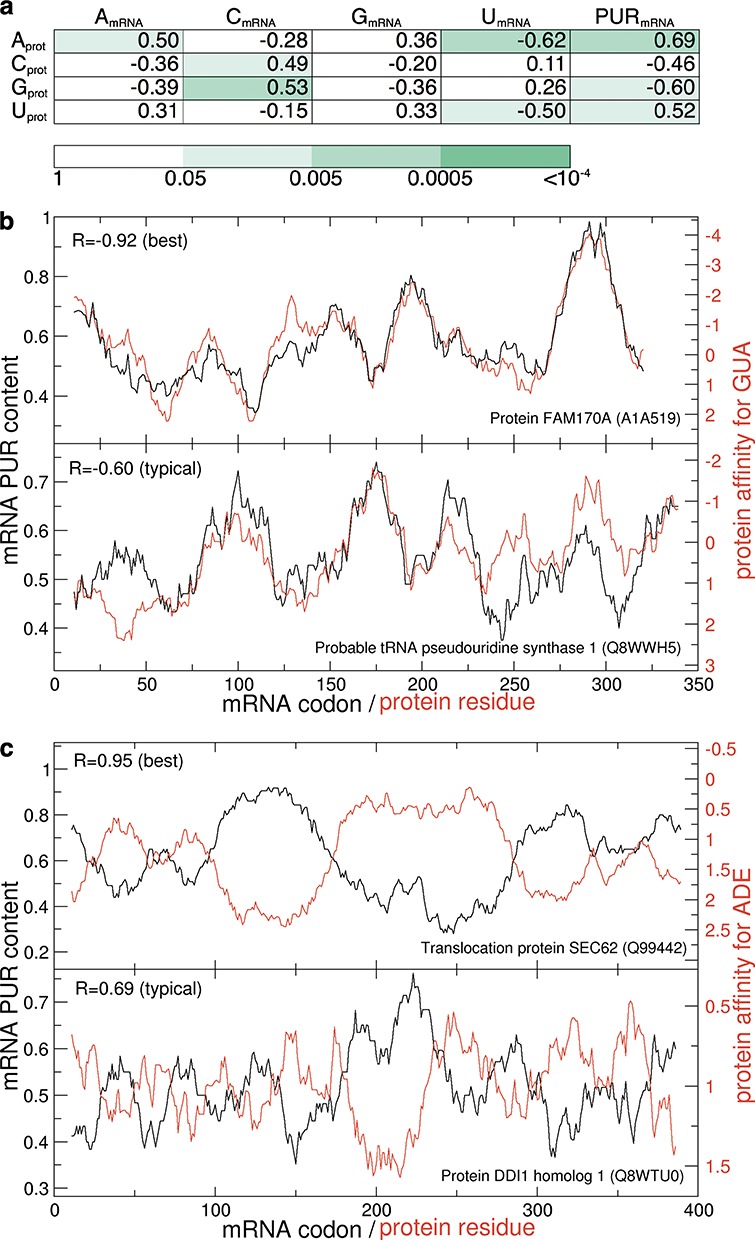
Figure 4.

Correlations between mRNA PUR sequence profiles and cognate protein profiles of affinity for nucleobases in methanol. Median Pearson correlation coefficients with colors representing P-values obtained by shuffling of the affinity scales (a) and example profiles for GUA (b) and ADE (c) affinity are shown. The best and typical examples in (b) and (c) are chosen from proteins with a representative length (300–400 residues).
