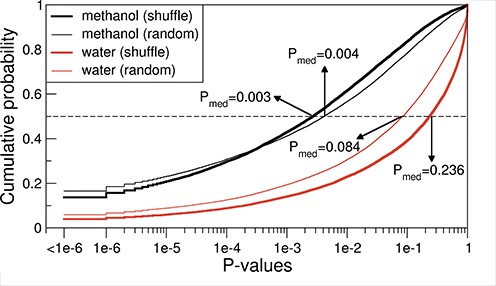
Figure 5.

Cumulative probability distribution of P-values capturing for each human protein the fraction of 106 randomized mRNAs with a lower ‘effective interaction energy’ with the protein sequence in question as compared to its original cognate mRNA as defined by water (red) or methanol (black) scales. Randomized mRNAs were generated either by shuffling the codons within mRNA sequences (thick lines) or by randomly picking codons from the genetic code table (thin lines). The median P-values over all human proteins are indicated with arrows.
