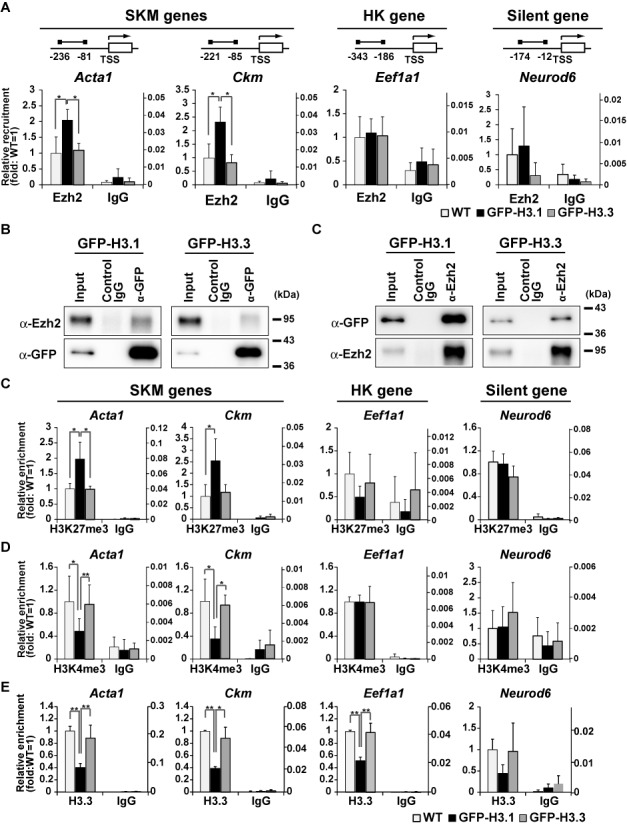
Figure 3.

Increases in H3K27me3 level and H3.1 incorporation into SKM gene regulatory regions. (A) ChIP-qPCR assay using Ezh2-specific antibody. The regulatory regions of SKM, HK, and silent genes in GFP-H3.1 and GFP-H3.3 expressing cells and in WT cells at growth state were analyzed. Recovery efficiency (mean ± standard deviation of three independent experiments) is expressed as relative enrichment to WT cells (left axis) and ratio to input (right axis). The positions of PCR primers are indicated on top. *P < 0.05, **P < 0.01. (B and C) Association of GFP-H3.1 and Ezh2. Chromatin prepared from GFP-H3.1 expressing cells was immunoprecipitated and probed using antibodies directed against GFP (B) and Ezh2 (C). (D-F) ChIP-qPCR assays. H3K27me3 (D), H3K4me3 (E), and H3.3 (F) were analyzed as in (A). Recovery efficiency (mean ± standard deviation of three independent experiments) is expressed as relative enrichment to WT cells (left axis) and ratio to input (right axis). *P < 0.05, **P < 0.01.
