
Figure 5.
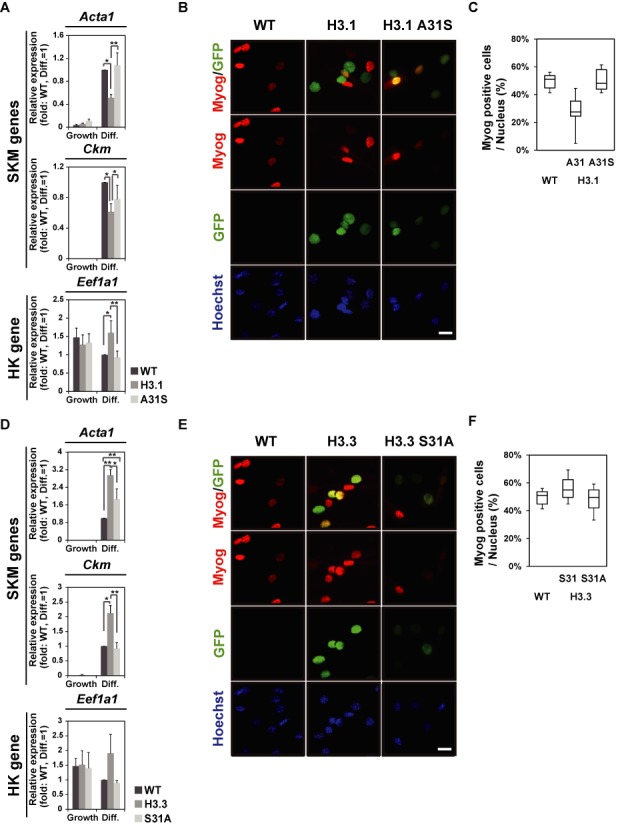
GFP-H3.1 A31S overexpression does not inhibit myogenesis and GFP-H3.3 S31A overexpression does not enhance myogenesis. (A) Q-PCR. mRNA expression levels of SKM marker genes were repressed in C2C12 cells expressing GFP-H3.1, whereas they were not in those expressing GFP-H3.1 A31S. Relative values to differentiated WT cells are presented (mean ± standard deviation of three independent experiments). (B) Immunofluorescence with Myog. (C) Box plot representation of the Myog-positive fraction among total nuclei identified by Hoechst staining. Ten different fields from images like (B) were analyzed. Scale bar, 20 μm. (D) Q-PCR. mRNA expression levels of SKM marker genes were enhanced in C2C12 cells expressing GFP-H3.3, whereas it was not in those expressing GFP-H3.3 S31A. Relative values to differentiated WT cells are presented (mean ± standard deviation of three independent experiments). (E) Immunofluorescence with Myog. (F) Box plot representation of the Myog-positive fraction among total nuclei identified by Hoechst staining. Ten different fields from images like (E) were analyzed. Scale bar, 20 μm.