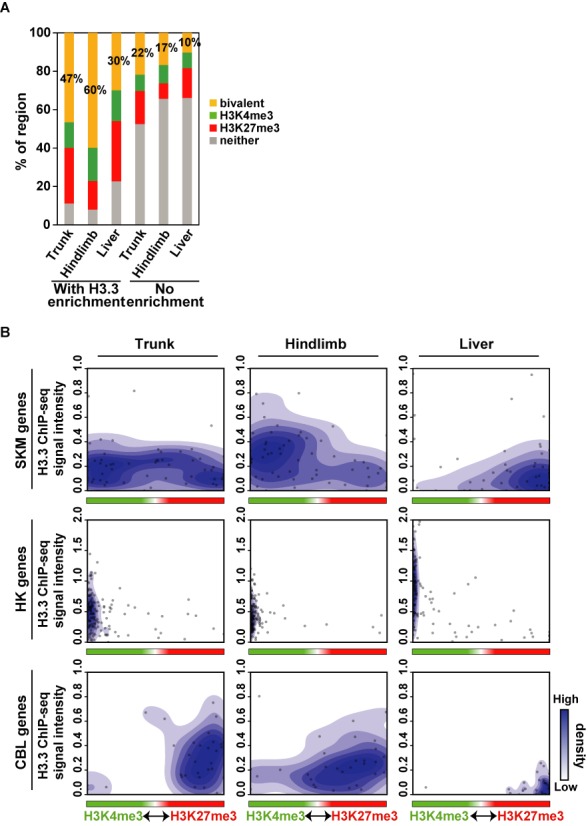
Figure 6.

Bivalenthistone modifications form on H3.3-containing SKM gene loci in mouse embryo. (A) H3.3-enriched regions showed more bivalent modifications than those exhibiting no modifications and tended to colocalize with H3K4me3 and H3K27me3 modifications. (B) The quantitatively balanced state of the bivalent modification was associated with H3.3 incorporation. The scatter plot represents the relative ratio of H3K4me3 and H3K27me3 modifications (x-axis) and H3.3 ChIP-seq signal intensities (y-axis) in tissue-specific genes at TSS ± 2 kb. Related data are shown in Supplementary Tables S6-8.
