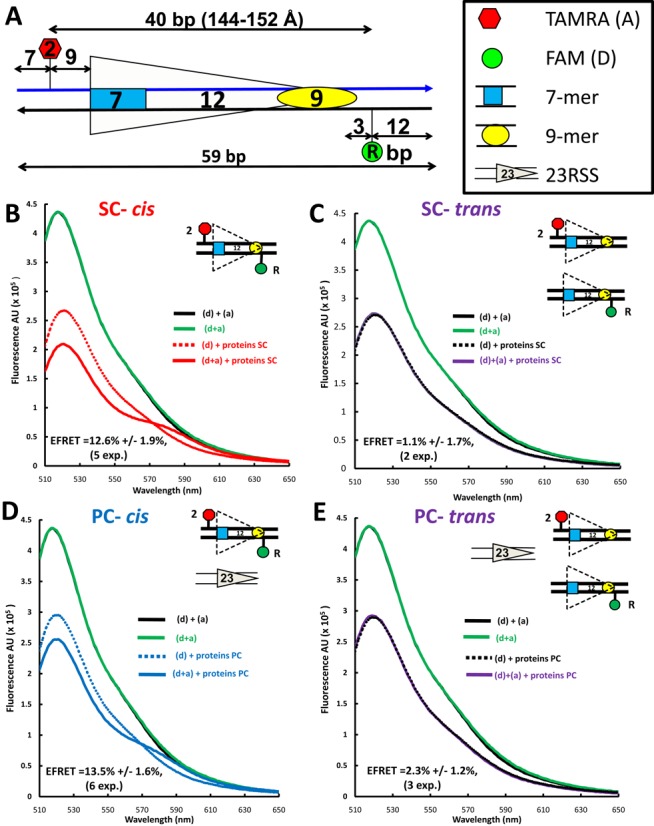
Figure 2.

Detection of energy transfer with the 12RSSdR2a substrate. (A) Schematic diagram of the 12RSSdR2a substrate showing the location of the donor and acceptor fluorophores (green and red shapes, respectively), the two DNA strands (blue and black lines) and the heptamer and nonamer (blue rectangle and yellow oval, respectively), separated by a 12-bp spacer. The donor FAM is located at the ‘R’ position in the nonamer flank, while the acceptor TAMRA is located at the ‘2’ position in the coding flank, with distances indicated in bp. (B–E) Representative steady state emission spectra (plotting fluorescence intensity in arbitrary units (AU) against emission wavelength) are shown for the 12RSSdR2a substrate with fluorophores in cis [panels (B) and (D)] or for a mixture of the singly labeled 12RSSdR and 12RSS2a substrates with the fluorophores in trans [panels (C) and (E)] under SC [panels (B) and (C)] or PC [panels (D) and (E)] conditions. The substrates are shown schematically as in Figure 2A. Solid black lines: a mixture of 12RSSdR and 12RSS2a in the absence of protein; green lines: 12RSSdR2a in the absence of protein; dashed lines: 12RSSdR (donor only) in the presence of RAG+HMGB1 without (for SC) or with 23RSS partner DNA (for PC); red line: 12RSSdR2a under SC conditions (RAG+HMGB1); blue line: 12RSSdR2a under PC conditions panel (RAG+HMGB1 and 23RSS partner DNA); purple lines: 12RSSdR + 12RSS2a in the presence of RAG+HMGB1 without (C) or with 23RSS partner (E). Proteins used were MBP-RAG1c, GST-RAG2c and HMGB1.
