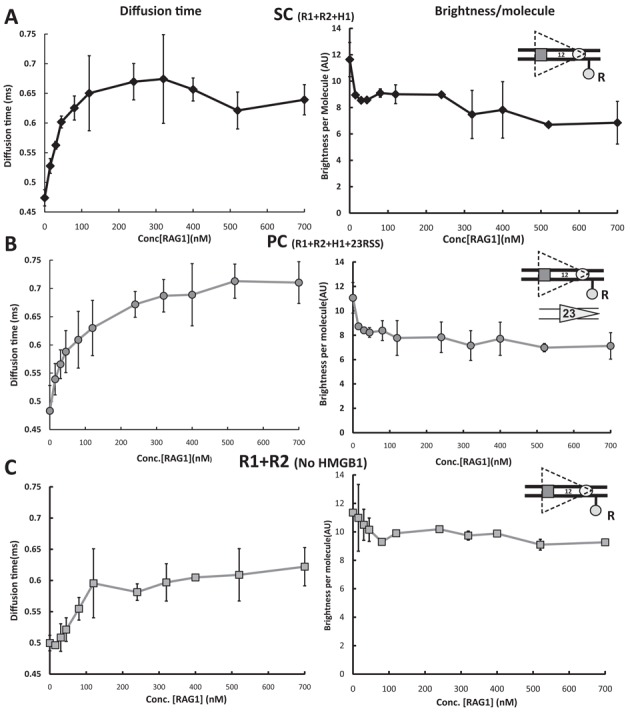
Figure 4.

RAG/HMGB1 binding to the 12RSS analyzed by fluorescence correlation spectroscopy (FCS). Photon emission traces were recorded from samples containing 5 nM Alexa 488-labeled 12RSSdR and increasing concentrations of protein mixtures in a fixed molar ratio as follows: (A) 12SC formation, using MBP-RAG1c, GST-RAG2c, HMGB1 in a molar ratio of 1:2:1.6 (black diamonds connected with black lines), (B) PC formation, using MBP-RAG1c, GST-RAG2c, HMGB1 and 23RSS in a molar ratio of 1:2:1.6:3 (gray circles connected with gray lines), (C) 12RSS–RAG complex, using MBP-RAG1c and GST-RAG2c in a molar ratio of 1:2 (gray squares connected with gray lines). Right-hand panels show brightness, or photons per labeled DNA molecule, plotted against RAG1 concentration, whereas left-hand panels show diffusion time versus RAG1 concentration. In (A) and (C), each data point represents the average of three independent measurements, whereas in (B), the average comes from six independent measurements (error bar = standard deviation).
