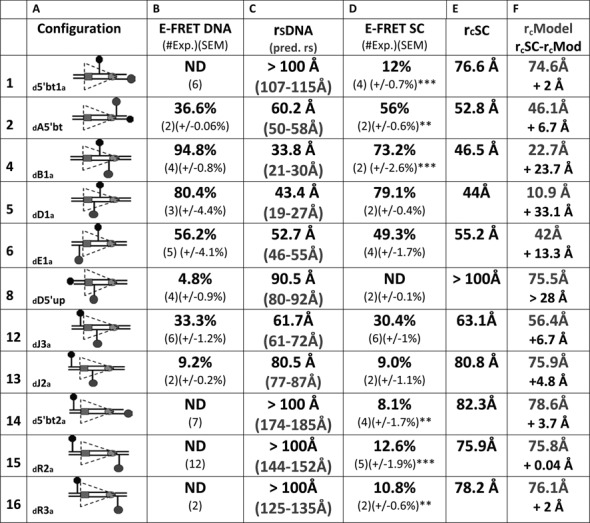
Figure 6.

FRET analysis of the 12RSS in the12SC. Data for 11 fluorophore-labeled substrates under SC conditions. Columns (A)–(C) designate the same features described in the Figure 5 legend. Column (D), average energy transfer efficiency for substrate in the complete reaction E-FRET SC, with the number of independent determinations and SEM in parentheses. Statistical comparison of E-FRET SC versus E-FRET DNA: *P < 0.05; **P < 0.01; ***P < 0.001; column (E), calculated distance between the donor and acceptor fluorophores in the substrate in the SC reaction rcSC, based on the E-FRET in column (D). Column (F), interfluorophore distances in the 12SC models shown in Figure 7 of the 12RSS (rcModel, gray), estimated by measuring the distance between the 5′ carbons of the sugars of the two fluorophore-labeled nucleotides. Below (black), interfluorophore distance derived experimentally minus the interfluorophore distance in the model for the 12SC (rcSC- rcM).
