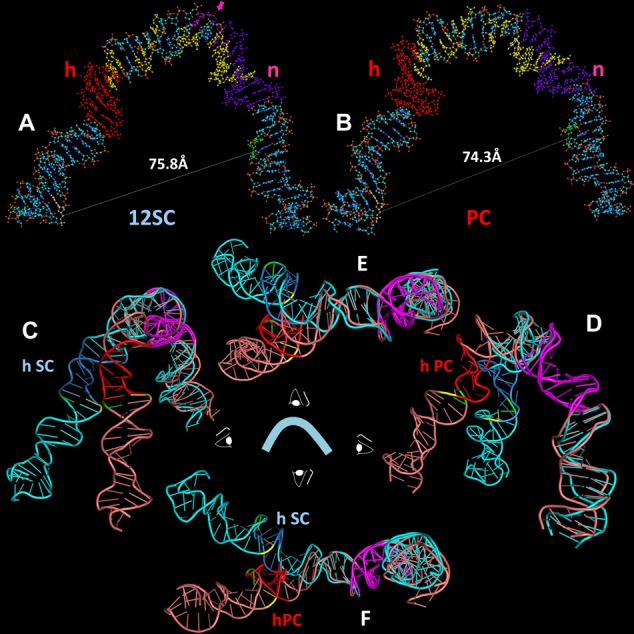
Figure 7.

Models of the structure of the 12RSS in the (A) SC and (B) PC, derived from molecular dynamics modeling of the data of Figures 5 and 6. DNA is depicted as a ball and stick model with N in blue, O in red, C in gray, P in orange and H in white. Indicated are the heptamer (h), shaded orange, nonamer (n), shaded purple, the bases that are donor (green) and acceptor (yellow) fluorophore labeled in the 12RSSdR2a substrate, the summative sites of ethylation interference in the RAG1-RAG2-HMGB1–12RSS (12SC and PC)complexes (yellow) and the site of DNAse I hypersensitivity (pink, with arrow) in the 12SC, as determined by Swanson (24). (C–F) Ribbon diagrams showing a superposition of the models of the 12RSS in the SC and the PC from four orthogonal perspectives of the ‘front’ view in (A) and (B), with the SC in blue (heptamer in dark blue) and PC in pink (heptamer in red). The nonamers in both models are in purple and were aligned to create the superposition. Also indicated are the scissile phosphates for nicking (green) and hairpin formation (yellow). (C) View from the left (heptamer/coding flank arm), (D) view from the right (nonamer arm), (E) view from above and (F) view from below.
