
Figure 1.
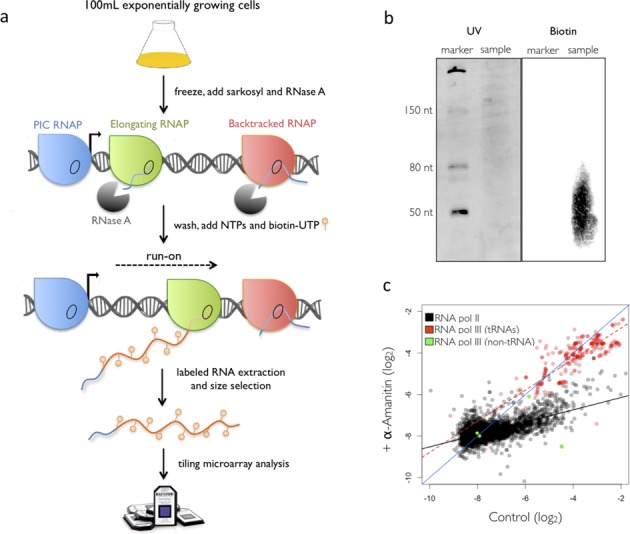
Outline of the BioGRO method. (a) The colours of RNA polymerases (RNAP) represent different transcriptional states. Only active elongating RNA pol II (green) is able to run-on. (b) Analysis of the size of the run-on elongation with Biotin-UTP. Biotinylated RNAs appear as a diffuse luminescent stain signal centred at about 50 nucleotides (nt). (c) BioGRO after a selective inhibition of RNA pol II with α-amanitin. The graph shows the comparison made between BioGRO signals in the presence or absence (control) of α-amanitin. In black, the RNA pol II genes and their trend line. The tRNA genes and their trend line are depicted in red. Green dots mark the RNA pol III transcripts that do not belong to the tRNA type.