
Figure 6.
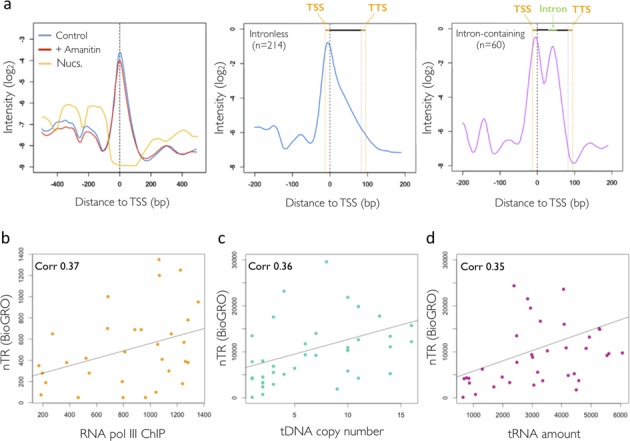
RNA pol III nascentome. In the upper part: (a) left panel: analysis of a metagene 5′ assay after the selective inhibition of RNA pol II with α-amanitin. Central panel: metagene tRNAs genes without intron. Right panel: metagene genes of tRNAs with introns. The entries at the top of both figures refer to the pre-tRNA structure: extensions 5′ and 3′ in orange, green introns. In the lower part, the correlations between: (b) the RNA pol III ChIP data from Kumar and Bhargava (31) and the BioGRO data; (c) the average nTR measured by BioGRO tRNAs of each family and the number of copies of the genes that make each family; (d) between BioGRO nTR and the amount of tRNAs for each family, taken from Tuller et al. (94).