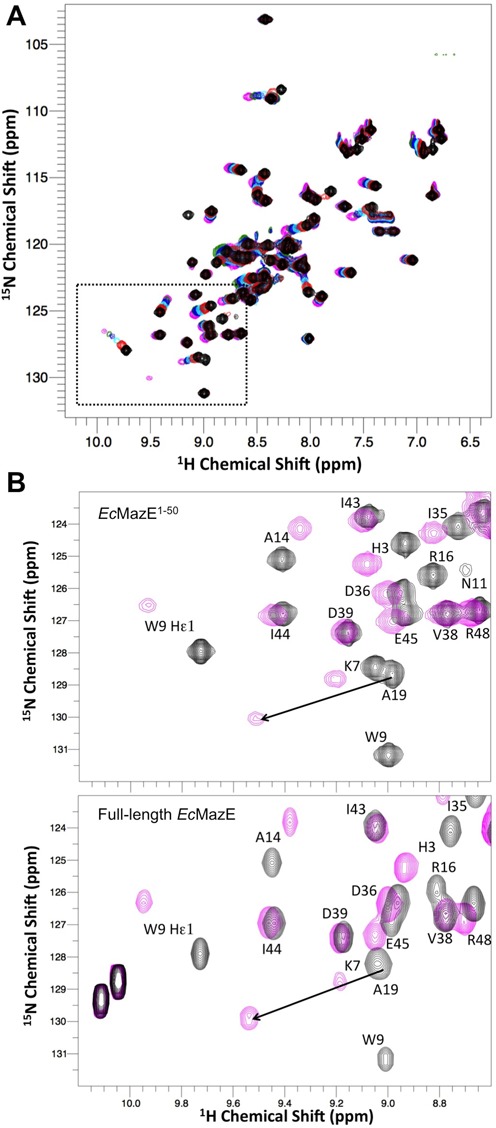
Figure 4.

Binding of DNA ‘a’ to EcMazE monitored by NMR. (A) 1H-15N-HSQC spectra recorded during titrations of EcMazE1–50 with DNA ‘a’. All spectra are plotted at the same contour level and are colored from black (free form) to magenta (last titration point). (B) Selected region of 1H-15N-HSQC spectra recorded during titrations of EcMazE1–50 with DNA ‘a’. Only NMR spectra of the EcMazE1–50 free form (black) and of the last titration point (magenta) are shown. For clarification, the black arrow indicates the direction of the chemical shift changes for Ala 19. (C) The same selected region of the 1H-15N-HSQC spectra of free full-length EcMazE (black) and in complex with DNA ‘a’ (magenta).
