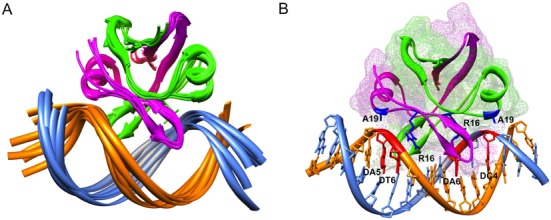
Figure 6.

Structural model of the EcMazE1–50–DNA ‘a’ complex. (A) Cartoon representation of the ensemble of the seven HADDOCK structures with the lowest interaction energies and lowest AIR violations. The two EcMazE1–50 monomers are colored green and magenta, the two DNA strands in orange and sky-blue. (B) Details of the EcMazE1–50–DNA complex showing the lowest-interaction energy structure of the ensemble. Color coding as in (A). The EcMazE1–50 dimer is also shown in mesh surface. Residues and nucleotides involved in H-bonding common in the ensemble are shown in blue (EcMazE1–50) and red (DNA) sticks, respectively. Figures prepared using Chimera.
