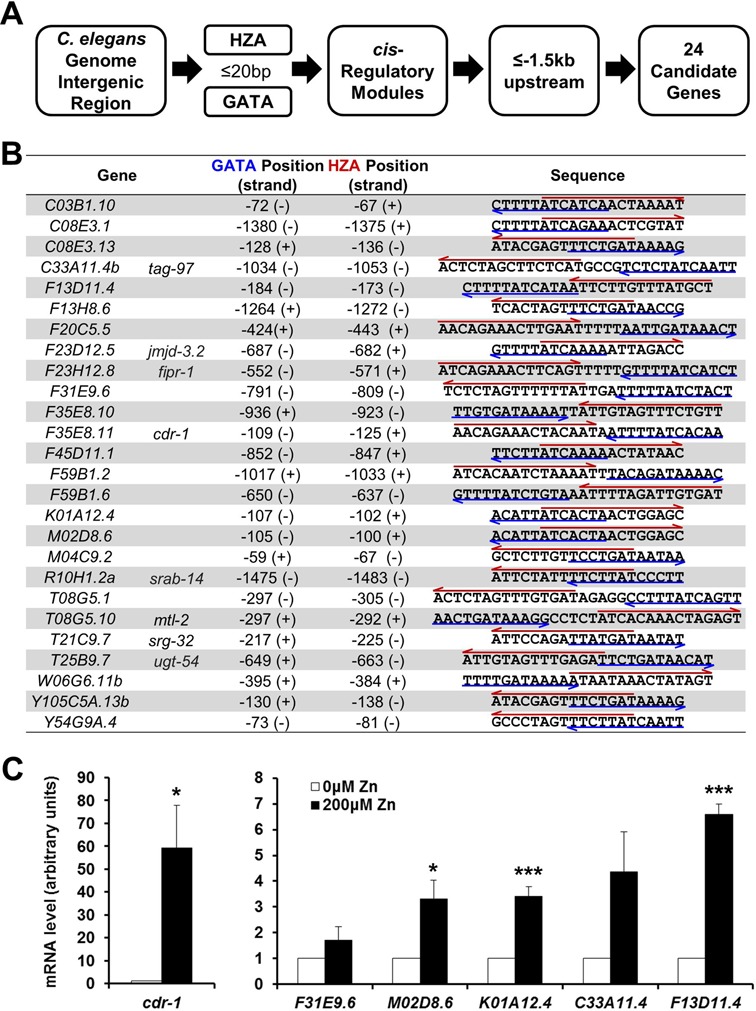
Figure 6.

Bioinformatic identification of new genes activated by high zinc. (A) A diagram of the steps used to identify candidate genes. (i) Identify all intergenic regions in the C. elegans genome. (ii) Identify the subset that contains both a HZA and a GATA element separated by less than 20 bp. To search for the GATA element, we used a 12-bp weight matrix, and to search for the HZA element, we used a 15-bp weight matrix. (iii) Identify the subset that have the HZA and GATA element located in a conserved cis-regulatory module (45). (iv) Identify the subset where the module is located <1.5 kb upstream of the translation start codon. (B) Twenty-four candidate genes met these criteria. Each gene has a genomic designation, and eight genes also have a genetic name (right). Numbers indicate the position of the upstream base pair of the GATA element or the HZA element. Positions are relative to the predicted translation start site of the gene (ATG), where the A is defined as +1 and the preceding nucleotide is defined as −1. (+) and (−) indicate the same and opposite orientation relative to the direction of transcription, respectively. The HZA and GATA elements are indicated by a red arrow over and blue arrow under the nucleotide sequence, respectively. (C) Wild-type animals were cultured with 0 or 200 μM supplemental zinc. RNA was extracted from a synchronized population at L4/adult stages, and mRNA levels of indicated genes were determined by qRT-PCR. The bars indicate mRNA levels at 0 and 200 μM supplemental zinc; mRNA levels at 0 μM supplemental zinc were set equal to 1.0 for each gene. Values are the average ± SEM of three independent experiments. The scales differ in the left and right panels. Comparisons are to the same gene at 0 μM supplemental zinc (*P < 0.05, **P < 0.01, ***P < 0.005).
