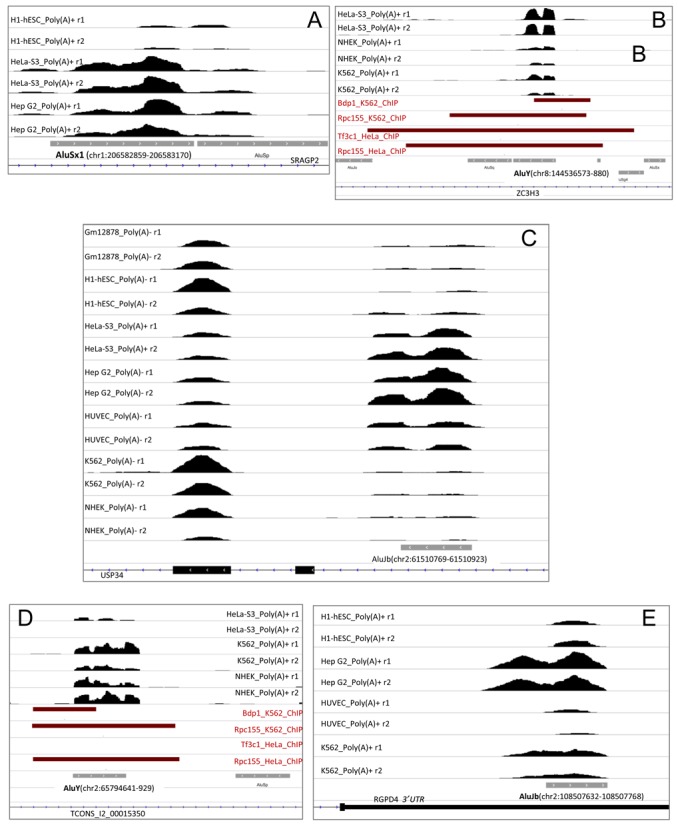
Figure 4.

Base-resolution expression profiles for five representative gene-hosted, sense-oriented Alus. Panels A–C refer to Alus hosted within introns of RefSeq genes, panel D to a 3′UTR-hosted Alu, panel E to an Alu hosted within a a lincRNA gene intron. Shown are the IGV visualizations of RNA-seq stranded expression profiles (in bigwig format) around Alu loci in the cell lines indicated either on the left (A–D) or on the right (E) of each panel. r1 and r2 tracks refer to the two independent replicates found in ENCODE data. The orientation and chromosomal coordinates of each Alu, as well as the host RefSeq or lincRNA genes, are indicated in each panel. The dark red bars in panels B and F identify regions associated to the indicated Pol III transcription component (Bdp1, Tf3c1 or Rpc155) in either K562 or HeLa cells as derived from ENCODE ChIP-seq data.
