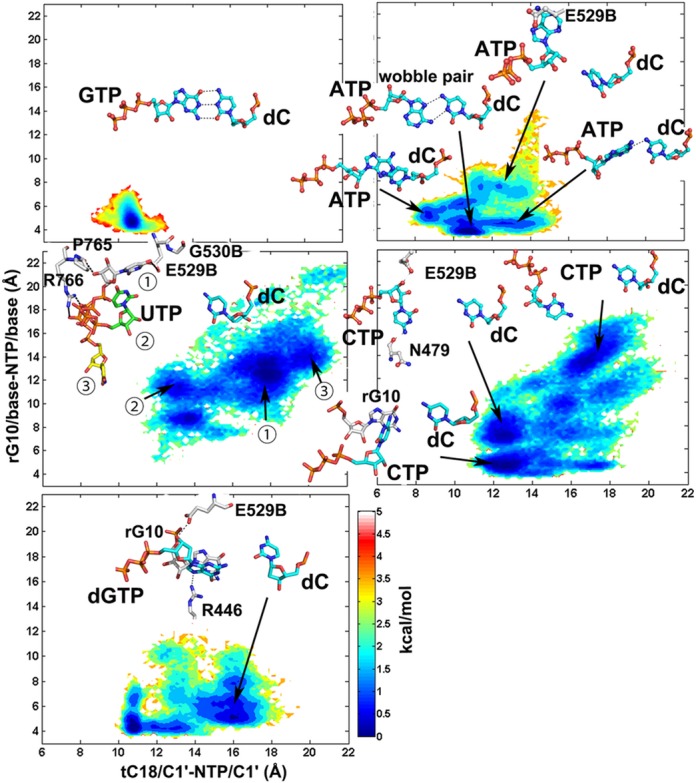
Figure 2.

Conformational sampling of NTPs opposing the template DNA dC base in RNAP II with an open TL. Potentials of mean force are plotted as a function of glycosidic torsion angles and NTP/C1′-DNA/C1′ distances. Representative structures are shown in stick representation. The three dC:UTP representative structures (

 ) were superimposed on all of the Cα and P atoms. The residues ending with a ‘B’ denote subunit Sc Rpb2/Tt β, all other residues refer to Sc Rpb1/Tt β′.
