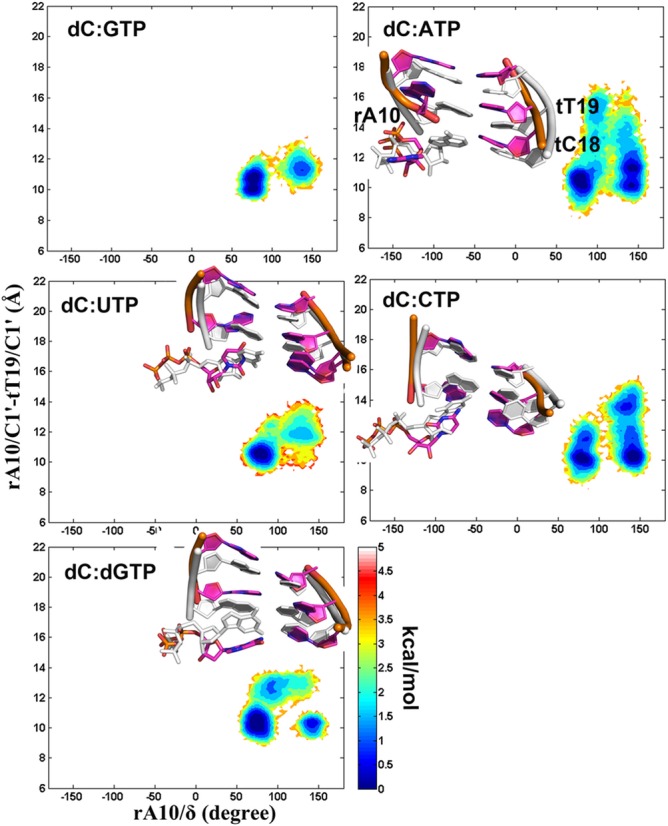
Figure 7.

Conformational sampling of the Sc nascent DNA:RNA base pair (tT19:rA10) with a closed TL. PMFs are plotted as a function of the rA10/δ torsion angle and the rA10/C1′-tT19/C1′ distance. Representative structures of the active site base pairs and two nascent base pairs in the initial structure (white) versus the simulated structure (magenta) after superimposing the entire complex on all of the Cα and P atoms are also shown.
