
Figure 4.
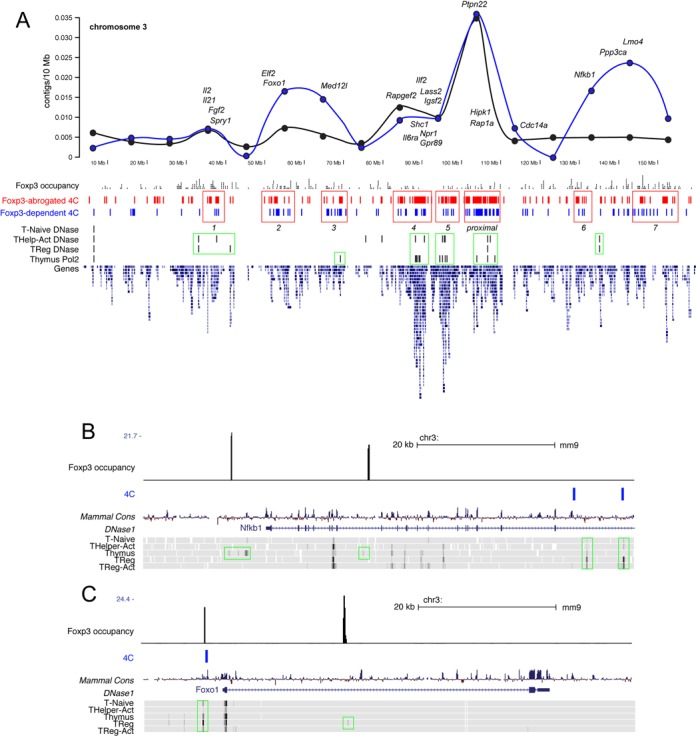
Distribution of intrachromosomal Ptpn22 interactions. (A) Full chromosome 3 contig frequencies are plotted (top panel) with the position of top FOXP3-dependent Ptpn22-interacting genes indicated. The distribution of all interactions (black line) versus the distribution of interactions involving direct Foxp3 target genes (determined by ChIP-seq, blue line) are shown. FOXP3 occupancy (black), and both FOXP3-abrogated (red) and FOXP3-mediated (blue) Ptpn22-interacting regions from this study are shown. DNase I hypersensitivity sites, RNA polymerase II occupancy and gene density from the ENCODE dataset are also depicted. (B) and (C) show examples of Foxp3 binding (black), Foxp3-dependent Ptpn22 interactions (blue) and coincident active chromatin signatures (DNase I HS, green boxes) at the NFκB1 and Foxo1 loci.