
Figure 1.
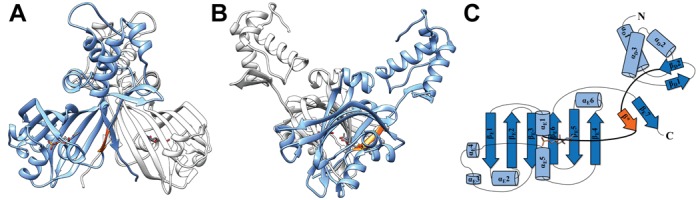
Crystal structure and topology plot of ligand-bound NagR. (A) Dimer of NagR in complex with GlcNAc-6-P in a cartoon representation with the monomers colored in blue and light gray and the ligand GlcNAc-6-P shown as a stick-model. (B) Side view of the complex after a 90° rotation. (C) Topology plot of monomeric NagR in complex with GlcNAc-6-P. Secondary structure elements are displayed as light blue cylinders (α-helices) and blue arrows (β-strands). The linker region between the DNA- and the effector-binding domain is highlighted in bold. The newly formed β-strand β* that appears upon ligand binding is colored in orange in all panels.