
Figure 5.
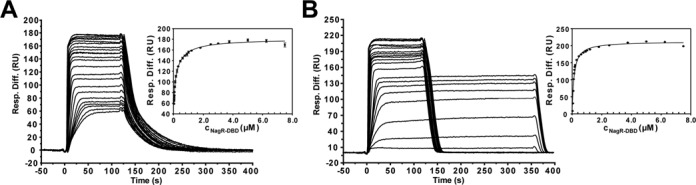
Quantitative analysis of NagR–DBD interactions with dre-site-containing dsDNA constructs. Sensorgrams from SPR analyses of the interaction of NagR–DBD with (A) palindromic and (B) native nagAB dsDNA for the respective triplicate measurements are shown. The corresponding diagrams for the determination of KD values are also included and display the SPR response units plotted versus the NagR–DBD concentrations which were fitted to the Langmuir equation for a 2:1 and a 1:1 binding reaction, respectively. The error bars indicate the standard deviation among triplicate data. The concentrations of NagR–DBD ranged from 20 nM to 7.5 μM for palindromic dsDNA and from 25 nM to 7.5 μM for native nagAB dsDNA.