
Figure 8.
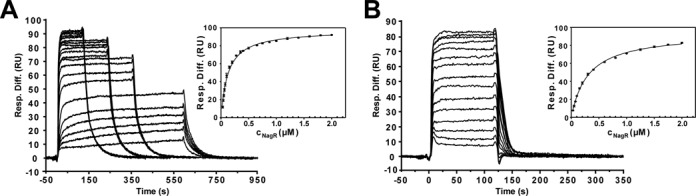
Quantitative analysis of the interaction of NagR with non-dre-site control dsDNA fragments. Sensorgrams from SPR analyses of the interaction of NagR with (A) a nagA gene derived and (B) a randomly designed control dsDNA of the respective triplicate measurements are shown. The corresponding diagrams for the determination of KD values are also included and display the SPR response units plotted versus the NagR concentrations. A Langmuir 1:1 binding model was applied. The error bars indicate standard deviations between triplicate data. The corresponding NagR concentrations ranged from 30 nM to 2 μM for both dsDNA constructs.