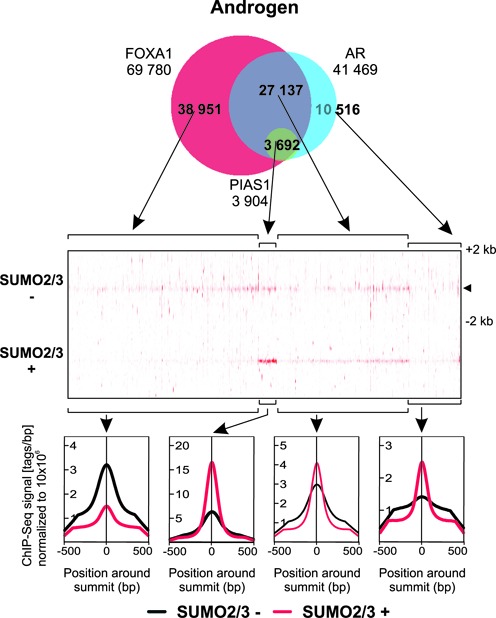
Figure 6.

Androgen-enhanced co-occurrence of SUMO2/3 at AR-, PIAS1- and FOXA1-shared genomic locations. Venn diagram showing the overlap of FOXA1, AR, and PIAS1 cistromes in cells exposed to androgen (upper panel). Heat map showing SUMO2/3 tag densities for indicated Venn sectors in a window ±2 kb (−, vehicle; +, androgen exposure) (middle panel). Comparison of SUMO2/3 average tag counts in ±500 bp from the centers of the indicated sites (lower panel).
