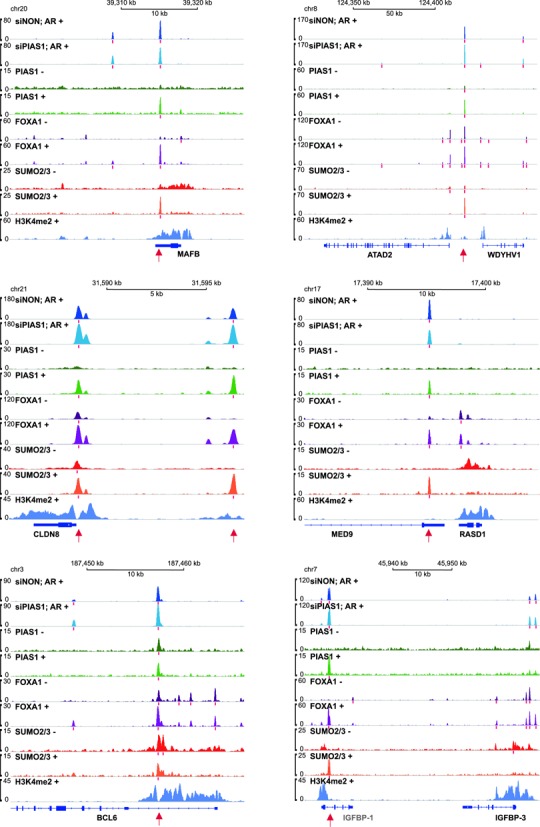
Figure 7.

ChIP-seq track examples of AR-, PIAS1-, FOXA1- and SUMO2/3-binding events in growth-associated AR target loci in VCaP cells. The occupancy of AR (dark blue in siNON-treated cells and light blue in siPIAS1-treated cells) and H3K4me2 (violet) in the presence of androgen (+, R1881 2 h) and that of PIAS1 (green), FOXA1 (purple) and SUMO2/3 (red) in the absence (−) and presence (+) of androgen. Red bars below the tracks depict the positions of the identified peak sites and red arrows sites co-occupied by AR, PIAS1, FOXA1 and SUMO2/3. Except for IGFBP-1, the expression of all loci was affected by androgen exposure.
