
Figure 8.
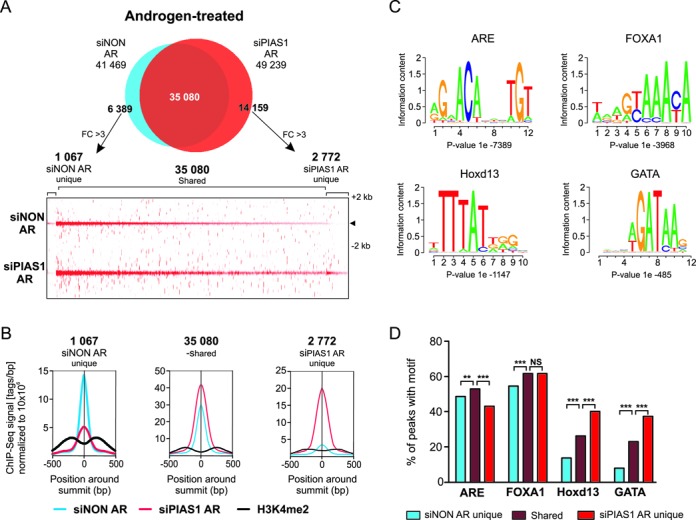
Influence of PIAS1 depletion on the AR cistrome. VCaP cells were treated as in Figure 7. (A) Venn diagram showing overlap of AR cistromes in siNON and siPIAS1 cells (upper panel). Non-overlapping sites were further analyzed using get-DifferentialPeak tool to achieve final categories. Heat map showing AR tag densities for siNON unique, siNON/siPIAS1-shared and siPIAS1 unique sites in a window ±2 kb (lower panel). (B) Comparison of AR and H3K4me2 average tag counts in ±500 bp from the centers of the shared and unique sites. (C) The four most enriched motifs of AR-binding sites in VCaP cells. Initial de novo motif discovery was performed on all AR-binding sites (siNON) on ±100 bp of the peak center. (D) Distribution of the most enriched de novo motifs in siNON unique, siNON/siPIAS1-shared and siPIAS1 unique sites. Statistical significances were calculated by χ2-test (***P < 0.001).