
Figure 3.
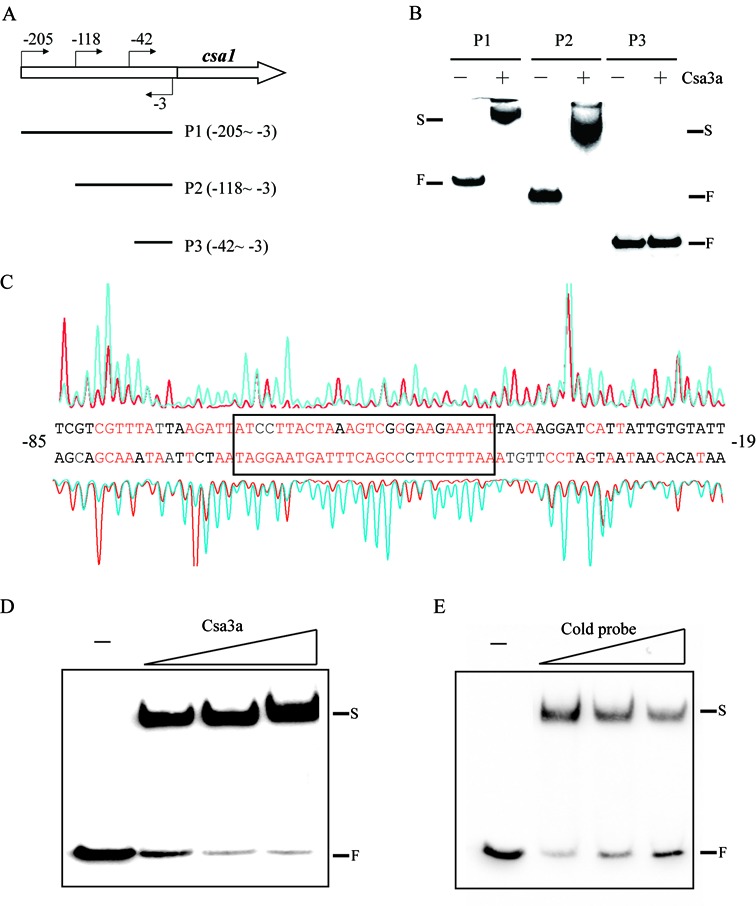
In vitro binding of the csa1 promoter by Csa3a. (A) Schematic diagram of the csa1 promoter and the DNA probes used for EMSA. The locations of primers used for amplifying the probes are indicated. (B) EMSA experiments using three truncated probes in the absence or presence of Csa3a (1.6 pmol/μl). F: free labeled probe; S: shifted band. (C) DNase I footprinting assay with coding (HEX-labeled, peaks above the promoter sequences) and non-coding (FAM-labeled, peaks below the promoter sequence) strands of the DNA fragments containing the csa1 promoter in the presence (red peaks) and absence (blue peaks) of Csa3a. The protected nucleotides (relative to the translational start codon) are shown in red and the minimal region is boxed. (D) EMSA experiment using the sequence of the boxed region indicated in (C) as a probe with increasing amounts of Csa3a (0.4, 0.8 and 1.6 pmol/μl). (E) EMSA experiment in the presence of Csa3a (0.4 pmol/μl) using the same probe as in (D) with increasing amounts of unlabeled nucleotides covering the csa1 promoter (molar ratio = 1: 1, 1: 4 and 1: 8).