
Figure 4.
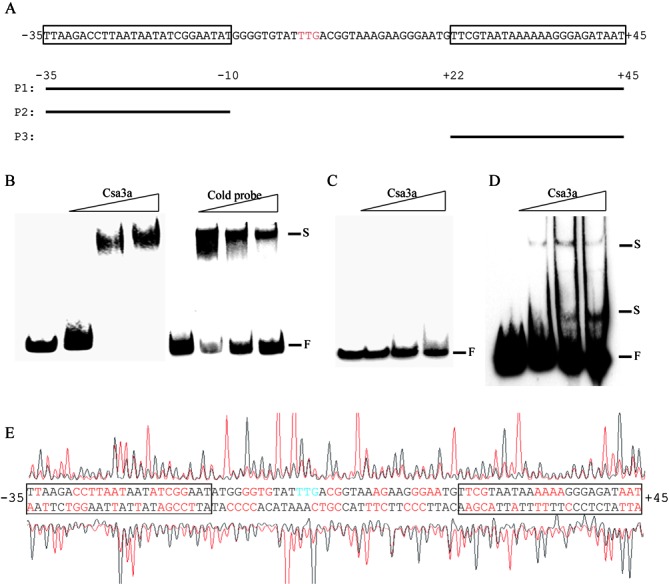
Identification of binding site of Csa3a on the cas1 promoter and cas1 coding sequence. (A) Schematic diagram of the cas1 promoter and the DNA probes used for EMSA. The translational start codon (TTG) is indicated in red. The locations of three probes relative to the translational start codon are indicated. Two regions similar to the minimal binding site of Csa3a on the csa1 promoter are boxed. (B) EMSA experiments using biotin labeled P1 as a probe with increasing amounts of Csa3a (0.4, 0.8 and 1.6 pmol/μl) or an unlabeled P1 cold probe (molar ratio = 1: 1, 1:4 and 1:8). (C and D) EMSA experiments using biotin labeled P2 or P3 as a probe with increasing amounts of Csa3a (2.4, 4.8, 6 pmol/μl). F: free labeled probe; S: shifted band. (E) DNase I footprinting assay with coding (HEX-labeled, peaks above the promoter sequences) and non-coding (FAM-labeled, peaks below the promoter sequence) strands of the DNA fragments containing the cas1 promoter in the presence (red peaks) and absence (black peaks) of Csa3a. The protected nucleotides (relative to the translational start codon) are shown in red and the regions similar to the Csa3a-binding site on the csa1 promoter are boxed.