Table 3.
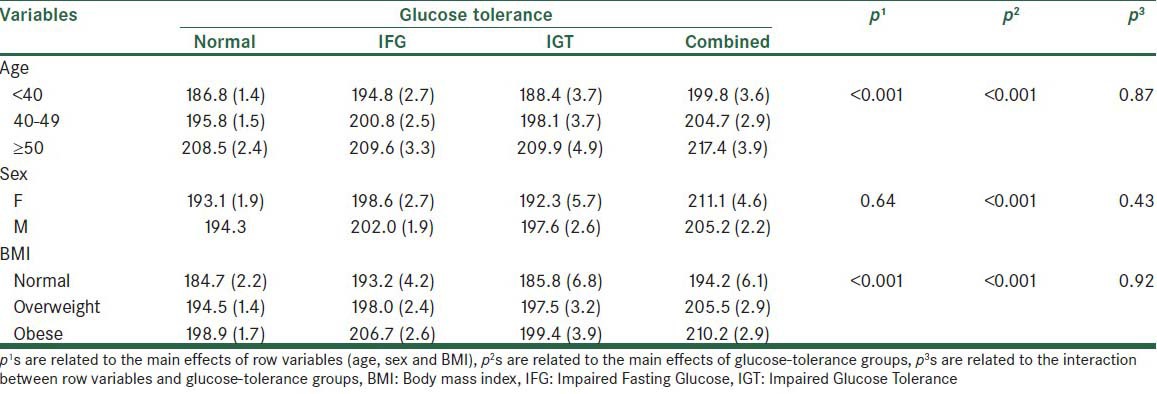
The mean total cholesterol levels (standard error) in the normal and glucose-tolerance groups at different levels of age, sex, and BMI variables

The mean total cholesterol levels (standard error) in the normal and glucose-tolerance groups at different levels of age, sex, and BMI variables
