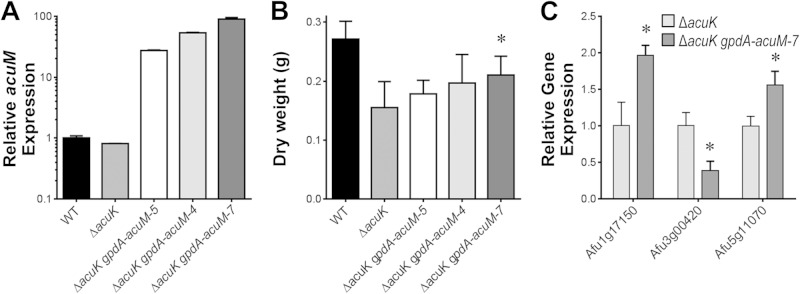
FIG 7.
Growth and gene expression profile of acuM overexpression strains under iron-limited conditions. (A) Relative acuM transcript levels in the indicated strains. Results are means ± SDs from 3 biological replicates, each performed in duplicate. (B) Dry weight of the indicated strains after growth for 48 h at 37°C in Sabouraud dextrose broth containing 30 mM phenanthroline. Results are means ± SDs from 3 independent experiments, each performed in duplicate. (C) Transcript levels of genes that were found to have significantly different expression in the ΔacuK gpdA-acum-7 overexpression strain compared to that in the ΔacuK mutant. Results are means ± SDs from NanoString analysis performed on 3 biological replicates. *, P < 0.03 compared to the ΔacuK strain.

