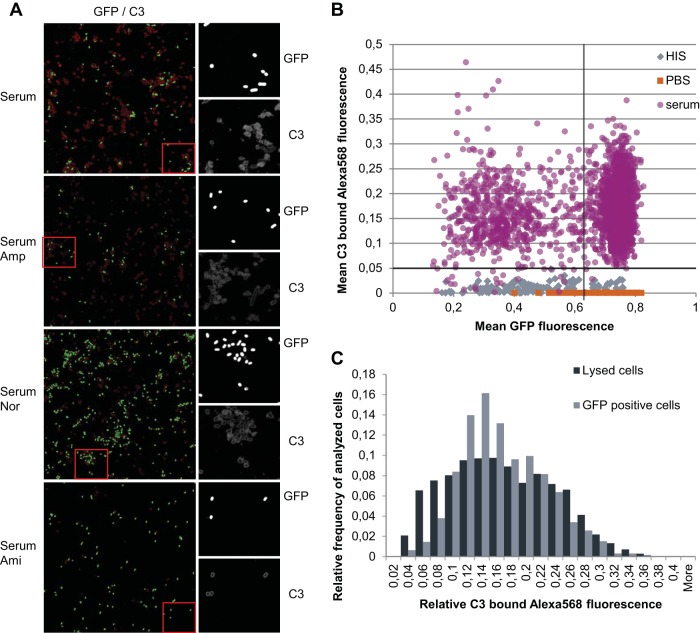
FIG 5.
Recognition and opsonization of CFT073 strain bacterial cells by serum complement. C3 deposition was measured by sequential C3 antibody staining and immunofluorescence microscopy. Cells were grown to stationary phase in LB medium and diluted in fresh medium (in PBS supplemented with either 50% HIS or 50% serum or in PBS alone) and incubated for 150 min at 37°C. (A) Immunofluorescence micrographs of GFP and C3-bound Alexa 568 fluorescence. Cells were grown in serum in the presence of ampicillin (200 μg/ml), norfloxacin (5 μg/ml), or amikacin (25 μg/ml), and C3 binding was detected by using immunofluorescence. From left to right is shown the GFP fluorescence inside the cells (visible GFP signal indicates intact cells) and the C3 deposition on cells (together with no GFP signal enables lysed cells to be identified); figure enlargements for GFP and C3 tile figures are also shown. Red dashed boxes show the exact locations of the figure enlargements on the tile figures. (B) Dot plot of C3-bound Alexa 568 and GFP fluorescence of cells incubated in HIS, PBS, or serum. Each dot represents the mean intensity (GFP and C3-bound Alexa 568) per cell measured. The dashed horizontal line indicates threshold value for cells with specifically bound C3. The dashed vertical line separates subpopulations of nondividing (high GFP levels) and dividing (low GFP levels) cells. (C) Relative distribution of cells by mean C3-bound Alexa 568 fluorescence. The objects examined were distinguished by the presence or absence of GFP. Objects with a mean GFP fluorescence higher than 0.01 (includes all cells shown in panel B) were considered live (GFP-positive cells). Objects with a GFP fluorescence ≤0.01 were considered lysed.

