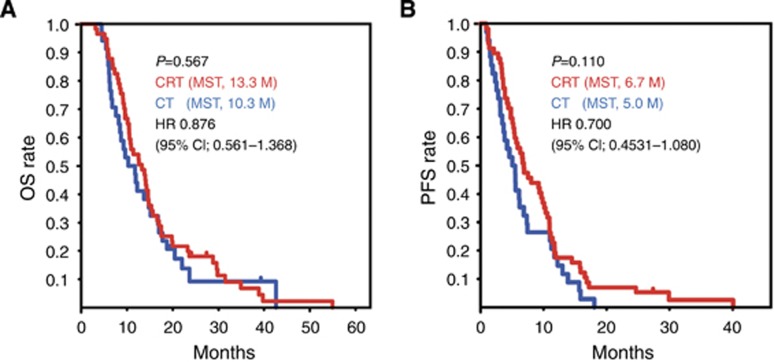
Figure 2.
Kaplan–Meier analyses of overall survival (OS) and progression-free survival (PFS) in all locally advanced pancreatic cancer (LAPC) cases. The survival curves of all LAPC patients treated with chemotherapy alone (CT, blue lines) or with chemoradiotherapy (CRT, red lines) are shown. Statistically significant differences in OS (A) and PFS (B) were calculated using a log-rank test. Median survival time (MST) is shown in months (M). The clinical benefit of CT vs CRT was calculated by univariate Cox regression analysis (hazard ratio (HR) and 95% confidence interval (95% CI)). The y axis is the rate of OS or PFS, and the x axis is the time after first diagnosis (months).

