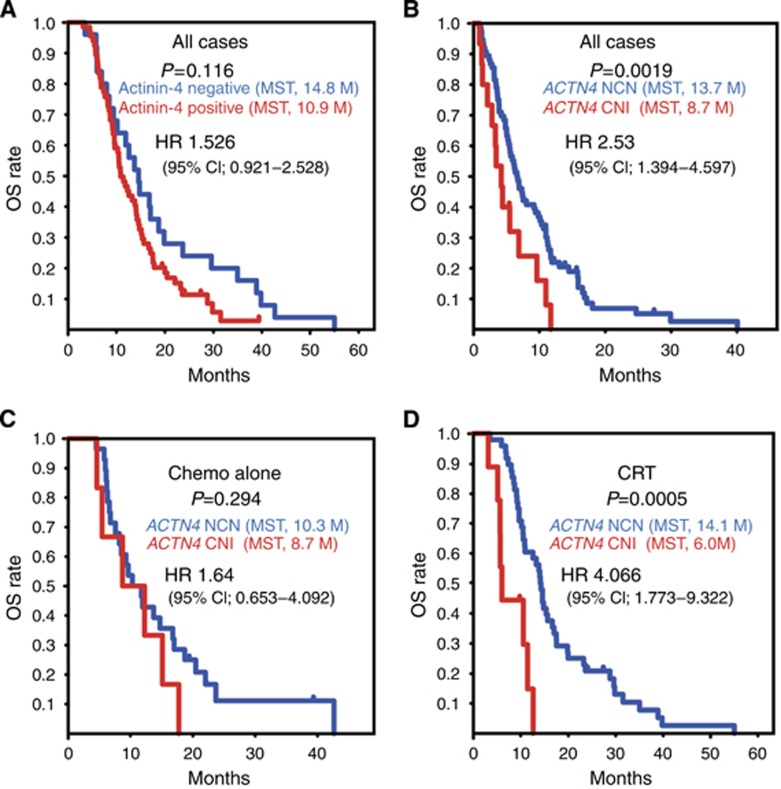
Figure 3.
Kaplan–Meier analyses of survival relative to protein expression of actinin-4 and copy number of ACTN4. (A) Overall survival (OS) curves based on protein expression of actinin-4. The blue line represents patients with negative expression of actinin-4. The red line represents patients with positive expression of actinin-4. (B–D) The OS curves based on ACTN4 copy number status in all cases (n=91) (B), in the subgroup treated with chemotherapy alone (Chemo alone, n=34) (C) and in the chemoradiotherapy (CRT)-treated subgroup (n=57) (D). The blue lines represent patients who were evaluated as normal copy number (NCN) of ACTN4. The red lines represent patients who were evaluated as copy number increase (CNI) of ACTN4. Statistical parameters were calculated as described for Figure 2. The y axis is the rate of OS, and the x axis is the time after first diagnosis (months).

