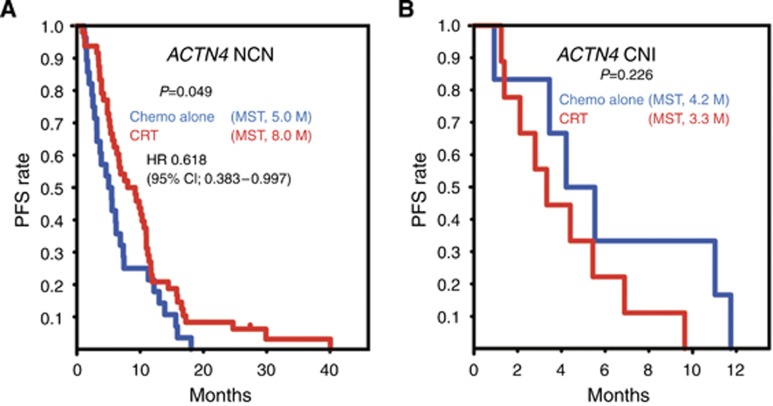
Figure 4.
Kaplan–Meier analyses of progression-free survival (PFS) in CNI and NCN subgroups of ACTN4. The PFS curves of patients with a NCN of ACTN4 (A) or a CNI of ACTN4 (B), treated with chemotherapy alone (chemo alone, blue line) or with chemoradiotherapy (CRT, red line). The y axis is the rate of PFS and the x axis is the time after first diagnosis (months). Statistical parameters were calculated as described for Figure 2.

