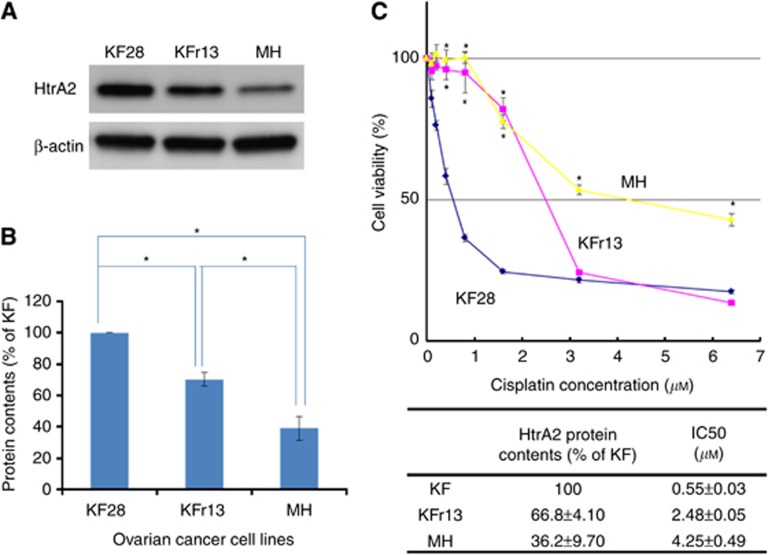
Figure 3.
HtrA2 protein expression and cisplatin sensitivity. (A) HtrA2 protein concentrations of KF28, KFr13, and MH were analysed by western blotting. (B) HtrA2 protein expression level that was densitometrically normalised against β-actin expression is shown. Blots were scanned and quantified by densitometry. HtrA2 protein concentration was significantly lower in KFr13 and MH compared with that of KF28. MH had significantly lower HtrA2 protein expression in comparison with KFr13. *P<0.01. (C) Cell viability of KF28, KFr13, and MH at the fifth day from cisplatin treatment was evaluated using the MTT assay. IC50 of KFr13 was higher than KF28 (P<0.01), and IC50 of MH was higher than that of KFr13 (P=0.01). The data represented the mean±s.d. of at least three experiments. *P<0.01.

