Figure 1.
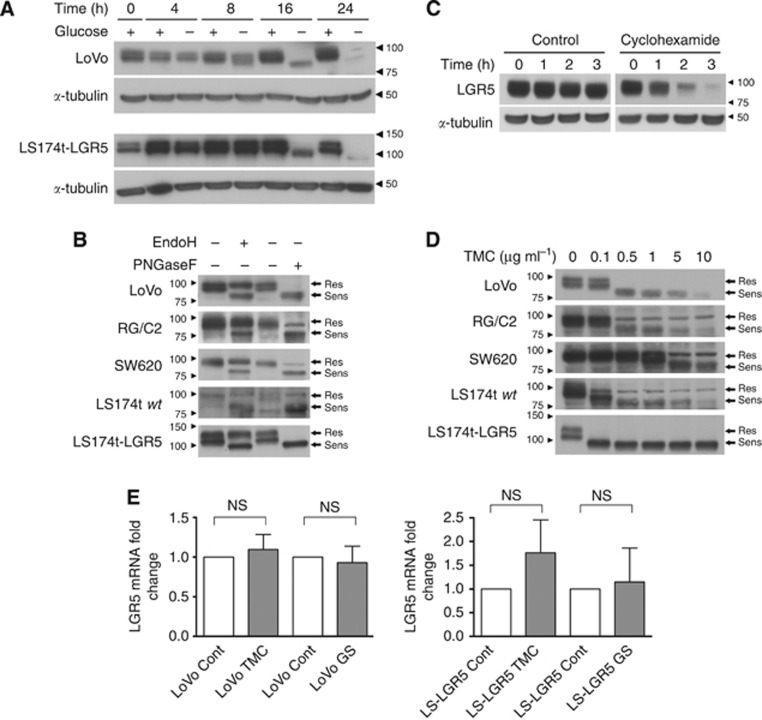
The glycosylation status of the LGR5 protein can be modified by glucose starvation and in vitro treatments. (A) Immunoblots showing LGR5 protein migration patterns from LoVo and LS174t-LGR5 cells cultured in glucose containing (+) and non-glucose containing (−) culture medium for 16 h. α-Tubulin indicates comparable protein loading amongst samples whereas adjacent right-side arrowheads and numbers indicate position of molecular weight markers (kDa) on blots. (B) Immunoblots showing LGR5 protein migration patterns from various CRT cell lines in response to endoglycosidase treatment or PBS control. Adjacent right-side arrows indicate the location of LGR5 forms either resistant (Res) or sensitive (Sens) to endoglycosidase treatment. Adjacent left-side arrowheads and numbers indicate position of molecular weight markers (kDa) on blots. Exposure times vary between all blots in order to clearly show LGR5 banding pattern and are thus not representative of relative LGR5 expression amongst the cell lines. Note the higher molecular weight of exogenous LGR5 protein in the LS174t-LGR5 line due to the presence of a double HA/FLAG tag. (C) Immunoblot showing LGR5 expression in LoVo cells treated with 10 μg ml−1 cyclohexamide or the equivalent water vehicle control for 0–3 h. α-Tubulin indicates comparable protein loading amongst samples. (D) Immunoblots showing LGR5 protein band conformation from CRT cell lines treated for 24 h with increasing doses of TMC. (E) Quantitative real-time PCR analysis of LGR5 mRNA in LoVo and LS174t-LGR5 cells following 16 h of glucose starvation (GS) or 24 h TMC treatment. Data represent mean±1 s.d., n=3. Statistical significance is denoted by **P<0.01, ***P<0.001 and NS=not significant as analysed by one-sample t-test.

