
FIG. 5.
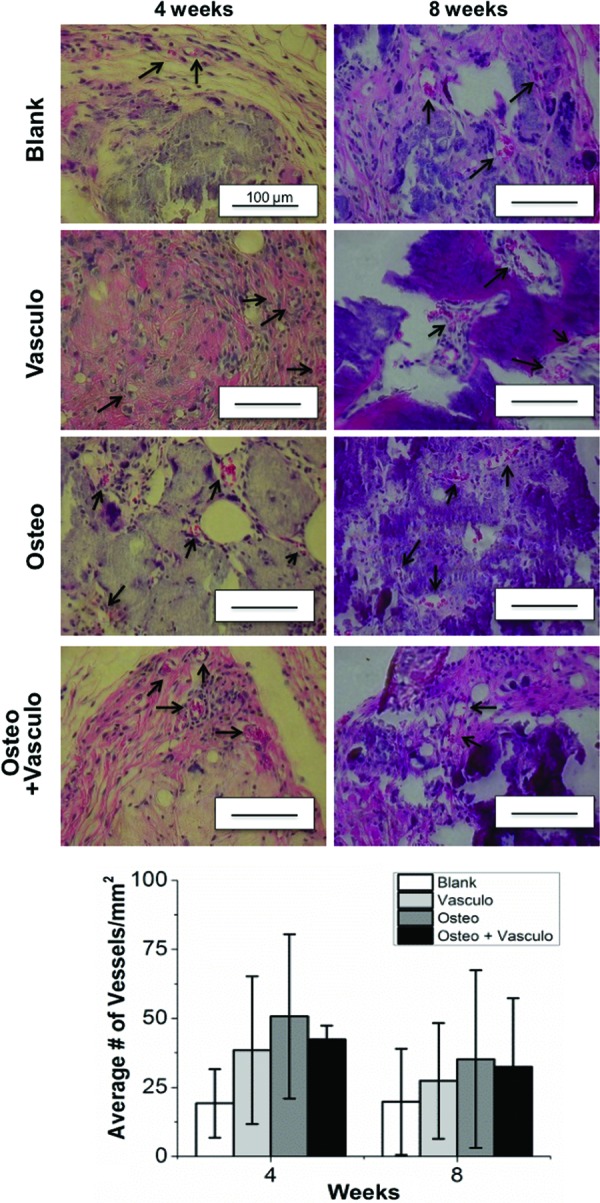
Histology of samples at 4 and 8 weeks postimplantation. Quantification of erythrocyte-containing vessels (arrows) showed no significant differences between any of the conditions at either time point (graph). Scale bar=100 μm. Color images available online at www.liebertpub.com/tea